Fig. 7.
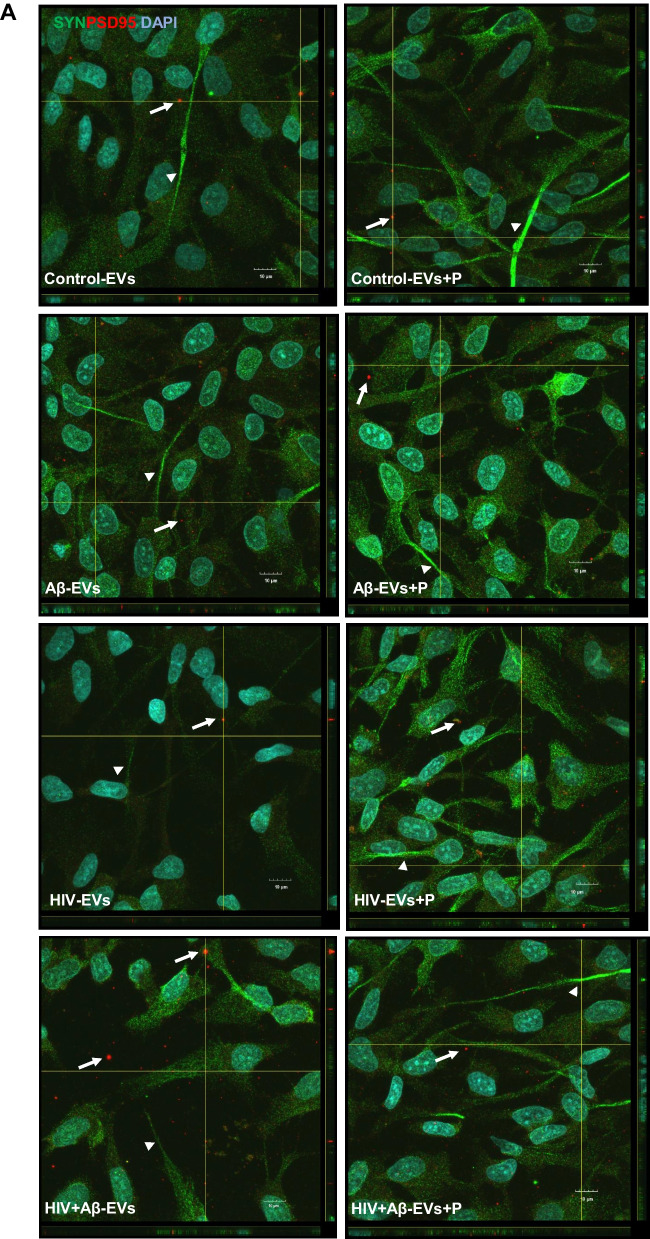
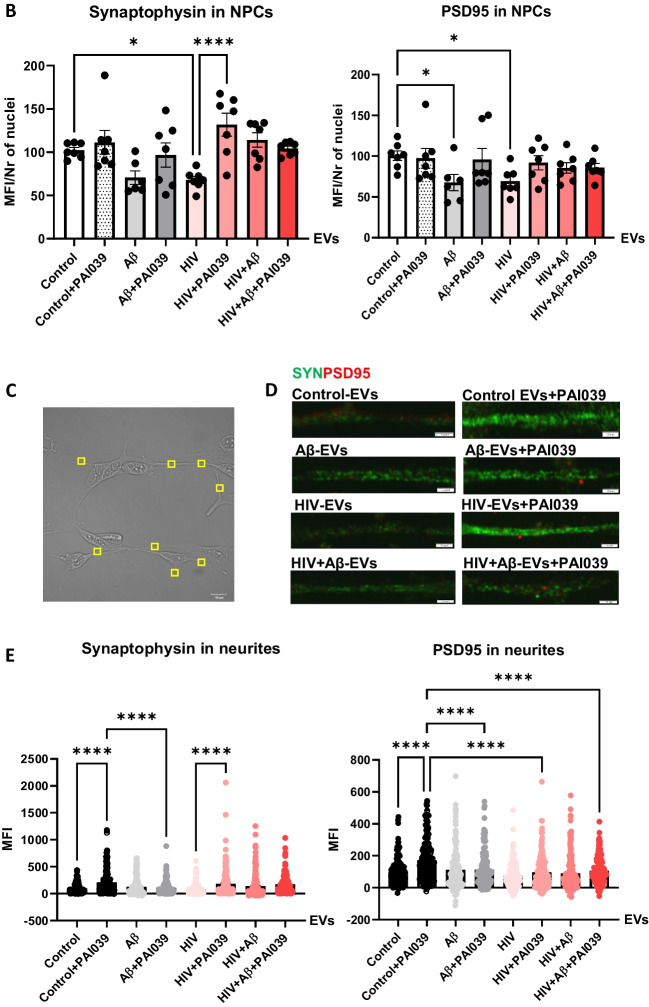
Impact of HBMEC-derived EVs on synaptic protein expression in NPCs. Non-transfected HBMEC were treated with HIV and/or Aβ and EVs were isolated as in Fig. 3. Then, human NPCs were exposed to HBMEC-derived EVs for 24 h, with selected cultures additionally treated with 2 µM PAI039 (P) as in Fig. 6. A synaptophysin (green; arrow heads) and PSD95 (red; arrows) immunoreactivity as imaged by confocal microscopy. DAPI staining (blue) visualizes the NPC nuclei. The combined z-stack images with maximum intensity projection are representative from three experiments. Scale bar: 10 μm. Individual panels are shown in Supplementary Fig. 2. B Total intensity of synaptophysin (left graph) and PSD95 (right graph) immunoreactivity as quantified from the confocal images. Values are mean ± SEM, n = 7. One-, two- and three-way ANOVA with Šídák's multiple comparisons tests. C Example of a brightfield confocal image with random identical rectangular areas on NPC projections. D Synaptophysin (green) and PSD95 (red) immunoreactivity on representative confocal images of NPC projections. Scale bar: 2 μm. E Intensity of synaptophysin and PSD95 immunoreactivity as quantified from random projection areas. Values are mean ± SEM, n = 160–180. One-, two- and three-way ANOVA with Šídák's and Tukey’s multiple comparisons tests. *Statistically significant at p < 0.05, ****p < 0.0001


