
FIGURE 1.
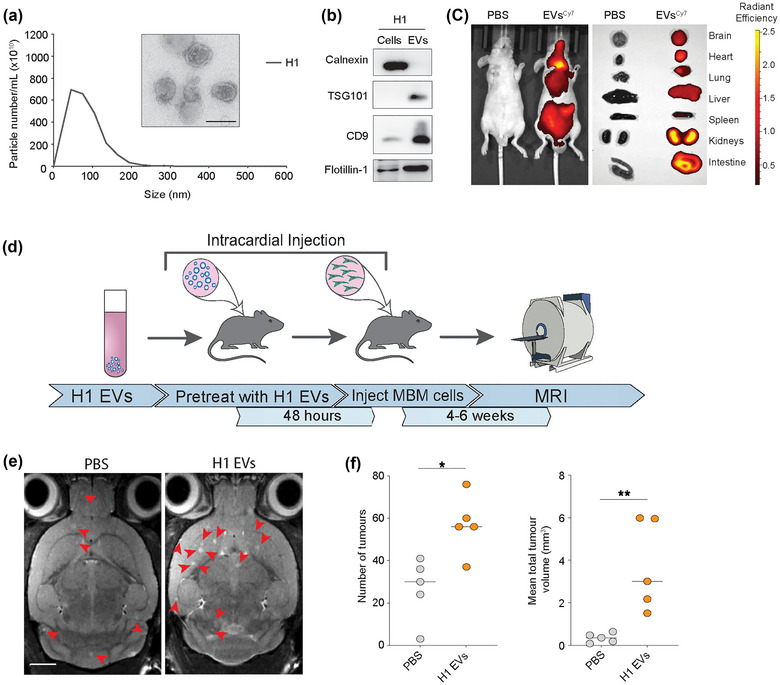
MBM‐EVs contribute to increased metastatic burden. (a) Representative nanoparticle tracking analysis using Malvern Nanosight and transmission electron microscopy of H1‐EVs. Size range 50–200 nm. Scale bar = 100 nm. (b) Western blot analysis of EV‐characteristic markers on H1 cells and corresponding EVs. (c) In vivo and ex vivo NIR imaging of mice and harvested major organs after injection of Cy7 (excitation/emission: 745/820 nm) H1‐EVs or PBS control. (d) Schematic workflow of the exosome‐primed in vivo metastatic model. (e) Development of brain metastasis assessed by T2 weighted MRI at week 4 after priming with MBM‐derived EVs or PBS prior to intracardial injection of MBM H1_DL2 cells. Scale bar = 2 mm. (f) Quantification of the total number and volume of brain metastasis at week 4 in exosome‐primed animals compared to the control PBS group. n.s. = not significant, *p < 0.05, **p < 0.01.