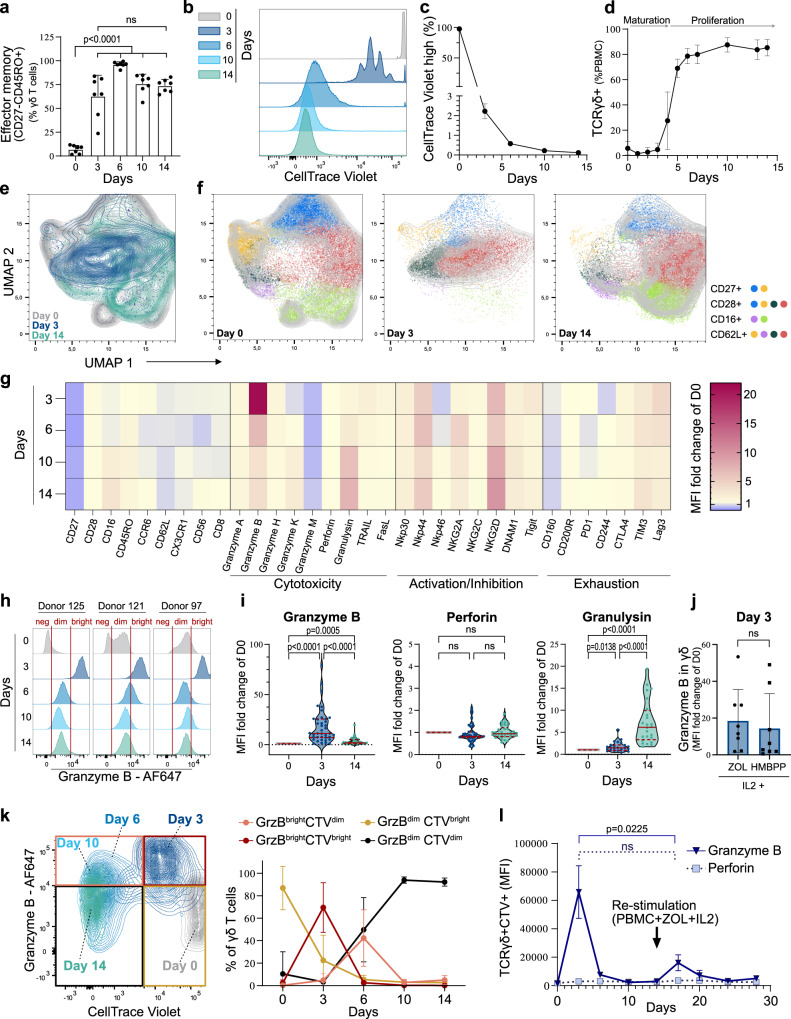
Fig. 1. Vγ9Vδ2 T cells transiently upregulate granzyme B before expansion.
a–i Phenotypic changes and cell division of Vγ9Vδ2 T cells measured by flow cytometry in peripheral blood mononuclear cells (PBMC) stimulated with zoledronate (ZOL) and IL2 at the indicated days. a Proportion of γδ T cells displaying an effector memory phenotype (CD27–CD45RO+), n = 7 donors, ANOVA statistical comparison. b Proliferation of γδ T cells in PBMCs initially stained by CellTrace Violet (CTV). c Percentage of CTV-stained γδ T cells which maintained the initial CTV high signal and therefore did not divide at the different time points, n = 3 donors. d Percentage of γδ T cells during the expansion, n = 4 donors. e UMAP dimension reduction of flow cytometry measurements of γδ T cells stained for CD27, CD28, CD16, CD62L, CCR6, and NKG2A during the expansion (contour plot with outlier points), n = 10 donors. f FlowSOM clustering of the γδ T cell as six subpopulations shown on the UMAP analysis (indicative contour plots from Fig. 1e in light grey). The markers mainly driving the population dynamics are shown on the right. g MFI fold-change of the indicated proteins during the expansion (normalised to MFI on day 0), n = between 6 (exhaustion) to 47 (granzyme B & perforin) donors. h Example of three donors with GrzBneg, GrzBdim and GrzBbright levels at day 0. i Violin plot (dots: individual donors; centre line: median; dotted lines: upper and lower quartiles) and ANOVA statistical comparison of expression fold-changes. j Granzyme B fold-change in expression at day 3 for PBMCs stimulated with IL2 and ZOL or IL2 and HMBPP, n = 8 donors. k Expression of granzyme B and intensity of CTV in γδ T cells during the expansion. The curves (right panel) report the proportion of high or low expressing populations gated as indicated in the example contour plot, n = 10 donors. l Expression of granzyme B and perforin during re-stimulation of 14-days expanded CTV-stained γδ T cells with ZOL and IL2 in thawed autologous unstained PBMCs for additional 14-days. Granzyme B amounts were measured by flow cytometry in the CTV+ γδ T cells, n = 3 donors. All applicable plots show means with standard deviations unless specifically stated otherwise. a, i–j one dot represents the measurement for one donor. Statistics were calculated using two-tailed ratio paired t-test unless stated otherwise. ns: not-significant.

