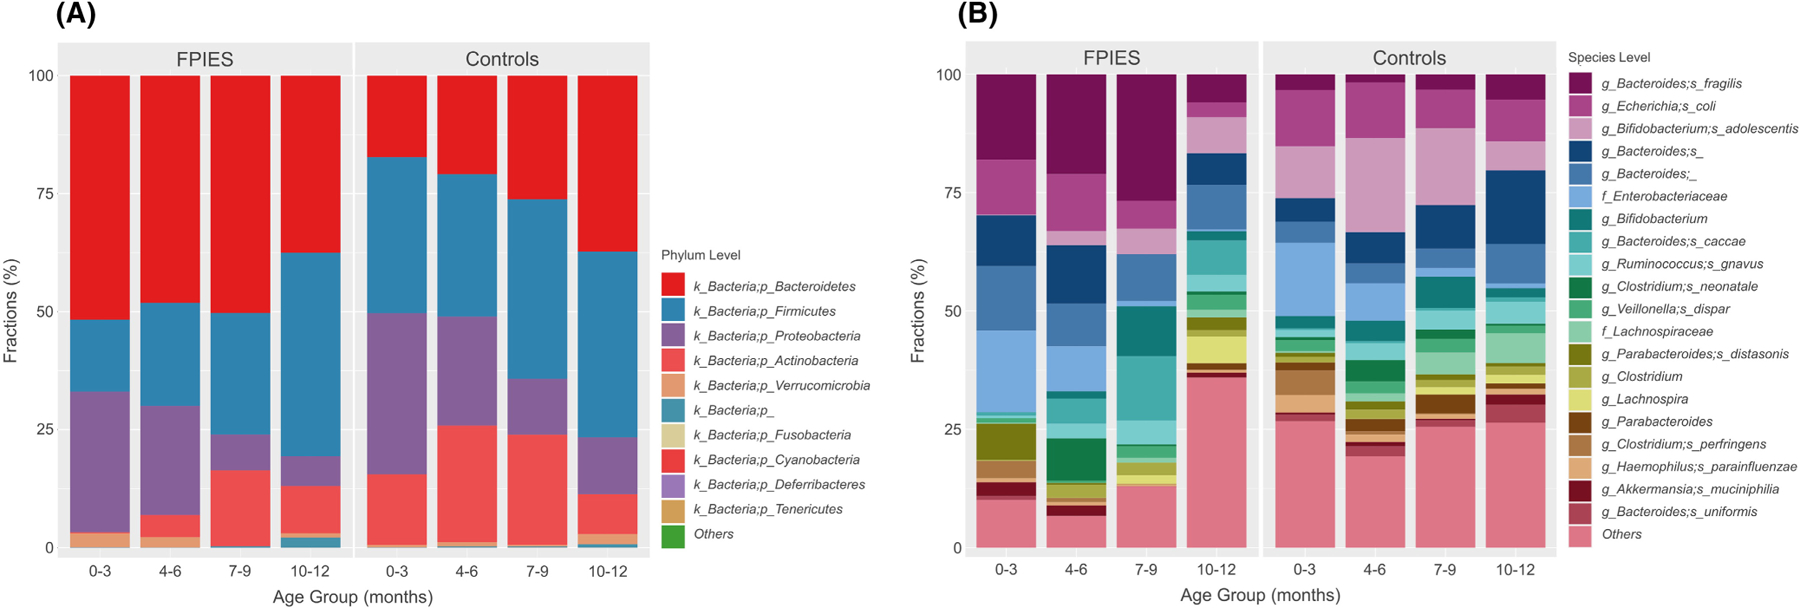
FIGURE 1.

The stacked bar plots demonstrate the difference between FPIES and controls in different age groups at the (A) phylum level and (B) species level. The case numbers provide stools for final analysis at each age groups: FPIES N = 8 (0–3 months), 7 (4–6 months), 4 (7–9 months), 6 (10–12 months); Controls N = 77 (0–3 months), 67 (4–6 months), 48 ((7–9 months), 35 (10–12 months).
