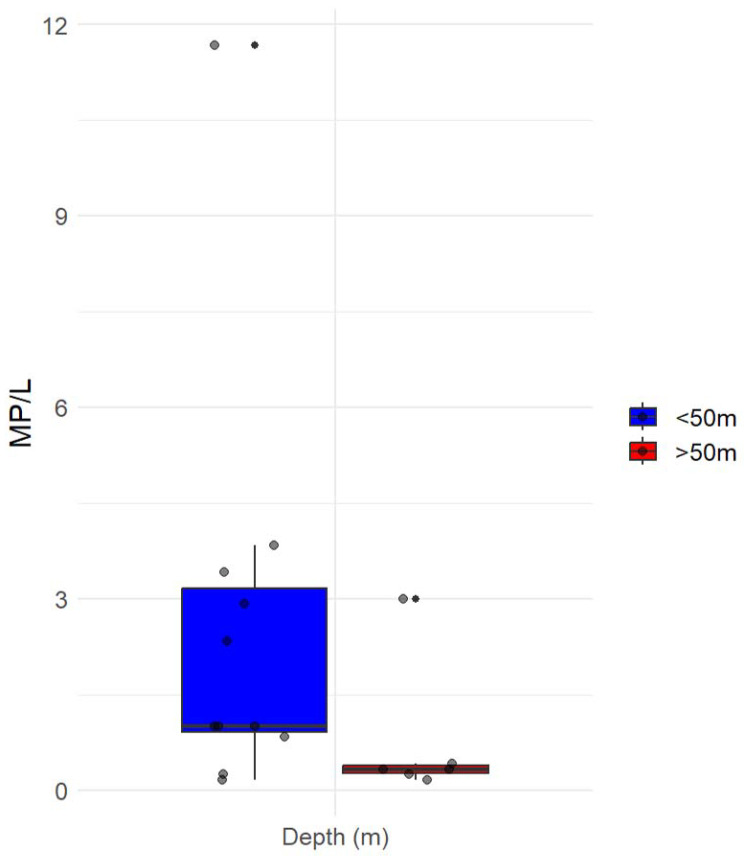
Figure 5.
The boxplot with quartiles included represents the vertical distribution of the number of the median value of microplastic particles per liter of seawater greater and less than 50 m below the sea surface. Jittered points are overlaid on the box plots to visualize individual data points within each group. Any data points beyond the whiskers are considered potential outliers and are plotted individually.

