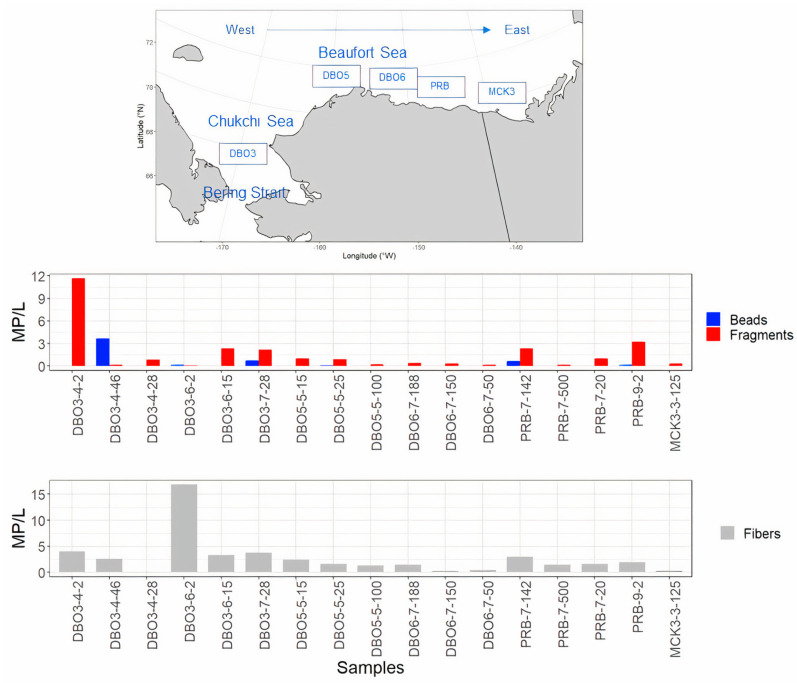
Figure 7.
This figure illustrates microplastic concentrations per sample using color-coded bars to represent various shape types (fiber, fragment, bead). Additionally, a map provides an overview of the sample locations. The upper box displays data for bead and fiber particles, while the lower box (in grey) focuses on fibers. Numerical values accompanying the station ID indicate the depths at which the samples were collected.

