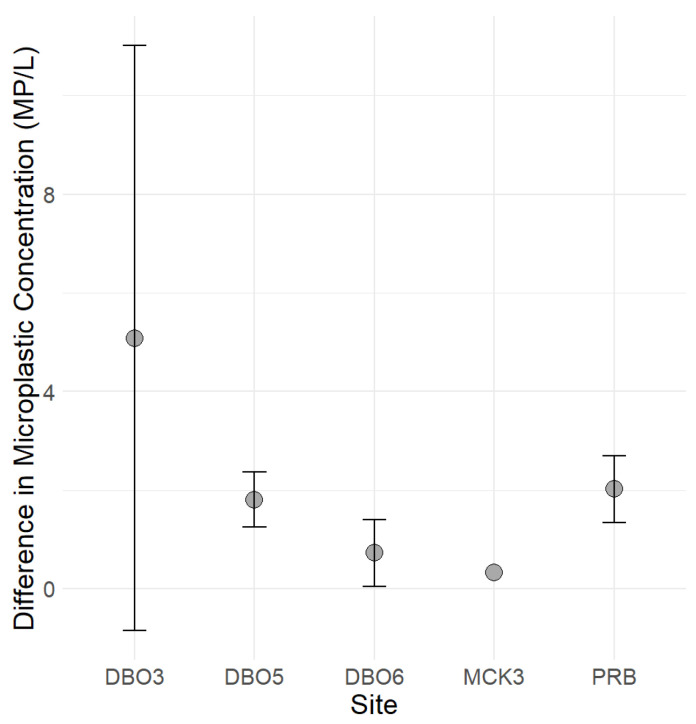
Figure 9.
Differences in microplastic concentration (MP/L) between samples with and without fibers at different sites. Grey dots represent the mean percentage difference, while error bars denote one standard deviation above and below the mean, highlighting the impact of fibers on the overall concentration.

