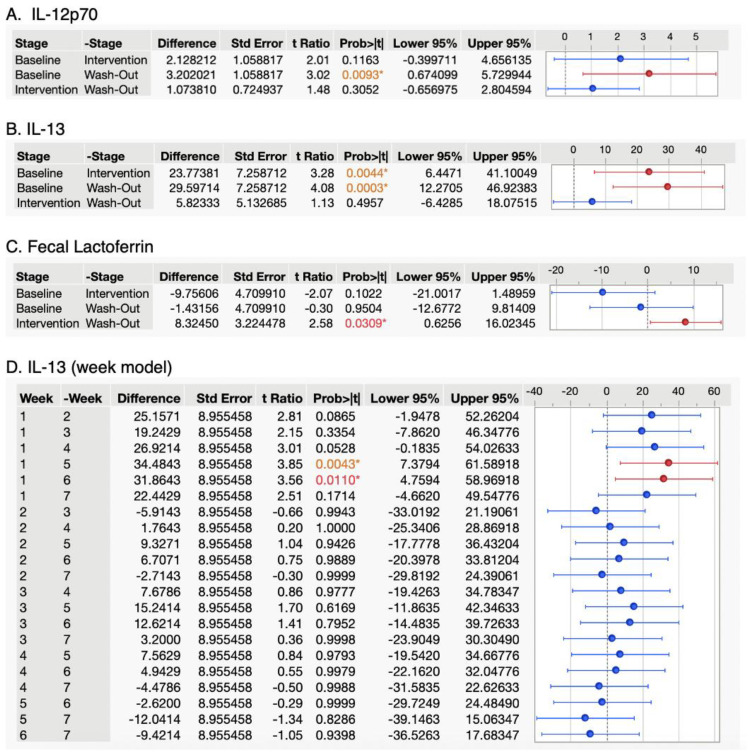
Figure 1.
Tukey’s HSD test for inflammatory markers with significant ANOVA p-values. Change in expression of inflammatory markers for which at least one stage or week was significantly different from any other. Horizontal error bars denote the concentration differences that represent the 95% confidence interval of the difference between the two stages represented in the HSD test. A * symbol indicates a statistically significant p-value, red text indicates a p-value less than 0.05, orange text indicates a p-value less than 0.01. Red intervals are significantly different from blue intervals.

