Figure 1.

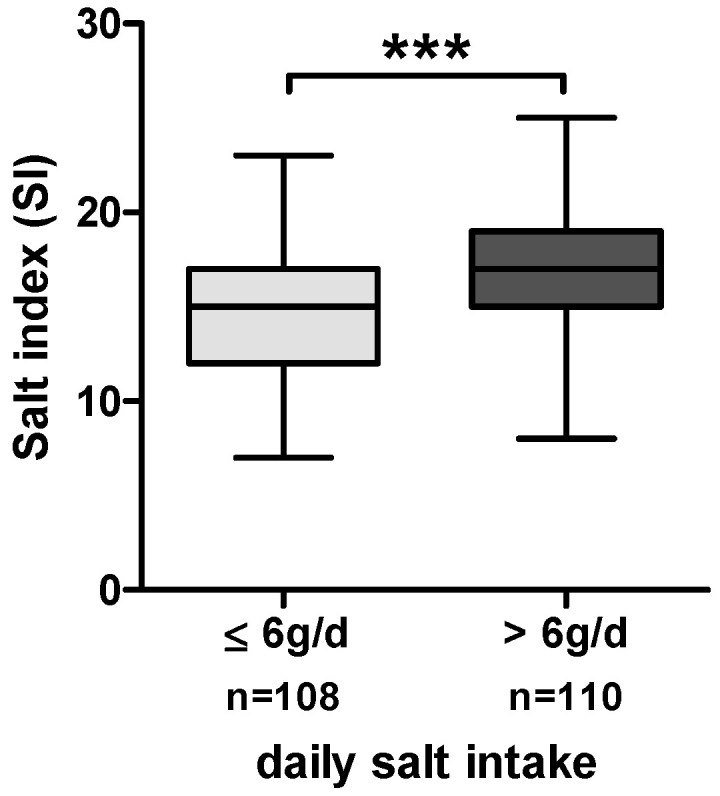
Boxplots of SI in the total cohort of MASLD patients stratified by daily salt intake (≤6 g/d and >6 g/d). *** = p ≤ 0.001.

Boxplots of SI in the total cohort of MASLD patients stratified by daily salt intake (≤6 g/d and >6 g/d). *** = p ≤ 0.001.