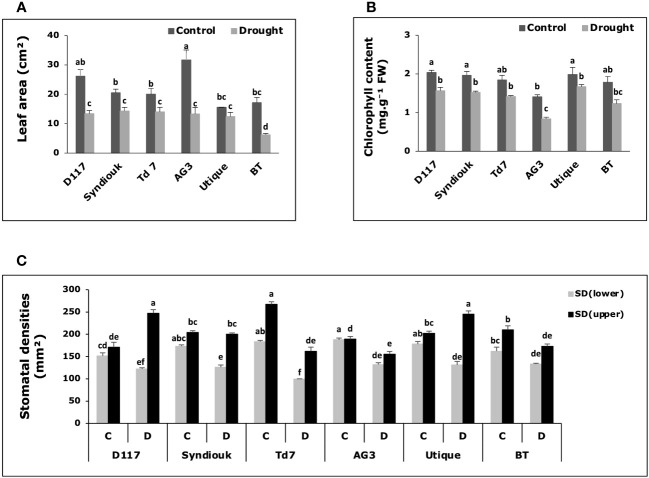
Figure 4.
Variations of physiological parameters in wheat genotypes grown under control (C) and drought stress conditions (D). (A) Leaf area; (B) total chlorophyll content; (C) stomatal density on lower leaf surface (SDlower) and upper leaf surface (SDupper). Data are the means ± S.D (n = 5). Means with different letters are significantly different at 5% level of confidence (P ≤ 0.05 according to Tukey’s test).

