Abstract
Overweight and obese (OW/OB) adults are at increased risk of hypertension due to visceral adipose tissue (VAT) inflammation. In this study, we explored gene level differences in the VAT of hypertensive and normotensive OW/OB patients. VAT samples obtained from six OW/OB adults (three hypertensive, three normotensive) were subjected to transcriptome sequencing analysis. Gene set enrichment analysis was conducted for all gene expression data to identify differentially expressed genes (DEGs) with |log2 (fold change)| ≥ 1 and q < 0.05. Gene Ontology and Kyoto Encyclopedia of Genes and Genomes functional enrichment analyses were performed on the DEGs, and hub genes were identified by constructing a protein-protein interaction (PPI) network. The proposed hub genes were validated using quantitative real-time PCR in ten other samples from five hypertensive and five normotensive patients. In addition, we performed ROC analysis and Spearman correlation analysis. A total of 84 DEGs were identified between VAT samples from OW/OB patients with and without hypertension, among which 21 were significantly upregulated and 63 were significantly downregulated. Bioinformatics analysis revealed that spleen function was related to hypertension in OW/OB adults. Meanwhile, PPI network analysis identified the following top 10 hub genes: CD79A, CR2, SELL, CD22, IL7R, CCR7, TNFRSF13C, CXCR4, POU2AF1, and JAK3. Through qPCR verification, we found that CXCR4, CD22, and IL7R were statistically significant. qPCR verification suggested that RELA was statistically significant. However, qPCR verification indicated that NFKB1 and KLF2 were not statistically significant. These hub genes were mainly regulated by the transcription factor RELA. The AUC of ROC analysis for CXCR4, IL7R, and CD22 was 0.92. What is more, VAT CXCR4 and CD22 were positively related to RELA relative expression levels. Taken together, our research demonstrates that CXCR4, IL7R, and CD22 related to VAT in hypertensive OW/OB adults could serve as future therapeutic targets.
Keywords: Hypertension, Overweight/obese adults, Visceral adipose tissue, Transcriptome sequencing
Introduction
Hypertension is the leading cause of cardiovascular disease (CVD) and early mortality worldwide and is therefore recognized as a major public health concern on a global scale [Hunter et al., 2021]. From 2000 to 2018, the overall number of fatalities from hypertension-related cardiovascular illnesses increased by 80% from 171,259 to 270,839 in the United States [Rethy et al., 2020]. Since hypertension is associated with multiple illnesses, including cardiac failure [Soenarta et al., 2020], atrial fibrillation [Naccache et al., 2017], coronary artery disease [Ge et al., 2018], and chronic kidney disease [Rigo and Orias, 2020], it is important to elucidate the etiology and molecular biological processes that underlie hypertension, as well as how they interact, in order to guide its diagnosis and treatment.
In recent years, the incidence of hypertension has increased in China, partially due to an increase in the prevalence of overweight/obese (OW/OB) individuals [Gou and Wu, 2021]. Although not all obese patients will eventually develop hypertension [Natsis et al., 2020], it is relatively difficult to treat obese patients with hypertension due to drug resistance [Rosolová, 2020]. It is possible that adipocyte malfunction is responsible for hypertension in obese patients [Blaj et al., 2003], and visceral adipose tissue (VAT) dysfunction may be the target of some drugs used to treat obesity-induced hypertension [Naguib et al., 2021]. Therefore, it is important to understand the precise molecular processes that underlie the development of hypertension in OW/OB patients in order to develop appropriate diagnostic and therapeutic strategies.
Recent studies have demonstrated that gene-level mechanisms play a critical role in the development of hypertension in OW/OB patients and have identified numerous genes and signaling pathways that are closely associated with the occurrence and development of obesity-related hypertension. These include mitochondrial DNA [Alé et al., 2017], the leptin receptor gene [Lu and Akanji, 2020], the SAH gene locus [Telgmann et al., 2007], the AMPK pathway [Deji et al., 2012], and the TGF-beta pathway [Alé et al., 2017]. However, the detailed genetic basis of hypertension in OW/OB patients remains largely unclear.
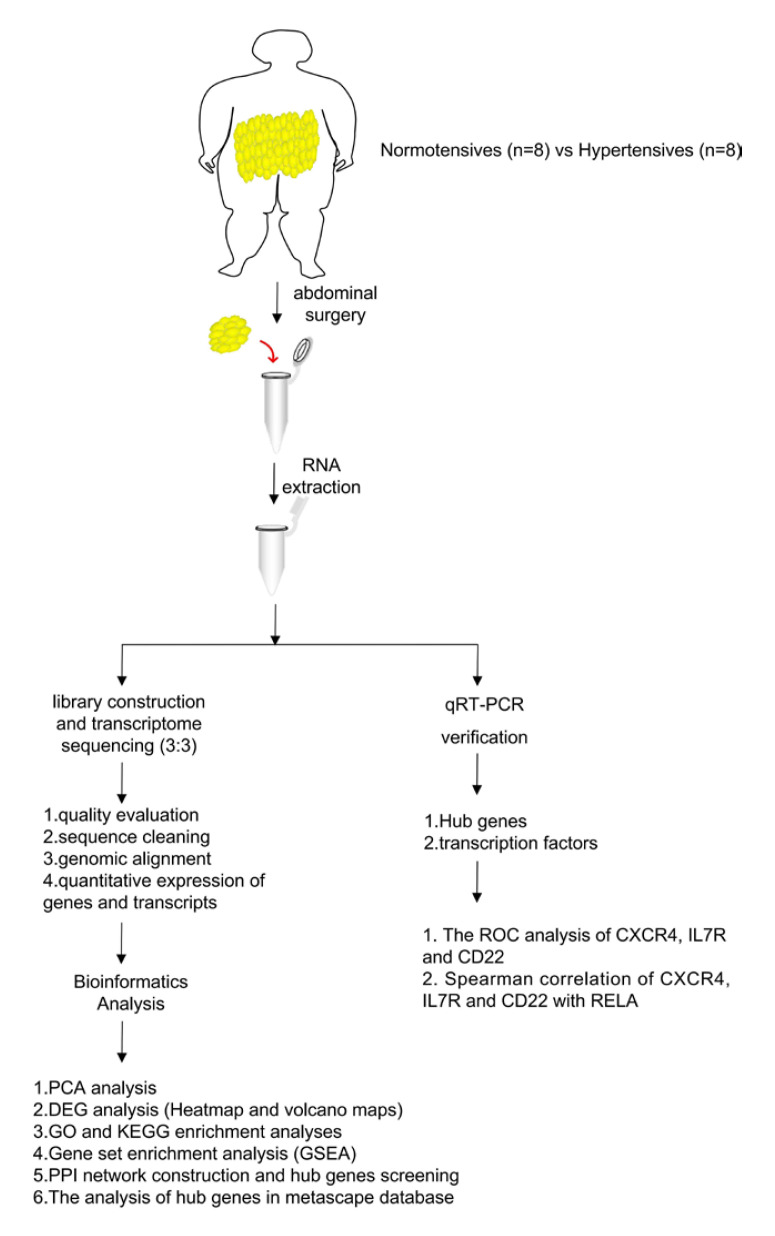
In this study, VAT samples were collected from hypertensive and normotensive OW/OB adults for transcriptome sequencing and subsequent bioinformatics analysis according to the study flow chart shown in Figure 1. Taken together, these analyses identified multiple hub genes that could serve as future therapeutic targets for OW/OB patients with hypertension.
Fig. 1.
Study flow chart.
Materials and Methods
Research Subjects
Sixteen OW/OB adults that were to undergo abdominal surgery at Yantai Yuhuangding Hospital (Yantai City, China) were enrolled in this research. The experimental group consisted of 8 hypertensive adults and the control group of 8 normotensive adults. From these subjects, VAT biopsies were taken; VAT samples from 3 subjects were used for transcriptome sequencing, while the other VAT samples were used to verify the sequencing results.
Patients were classified as being OW/OB if BMI was ≥25 kg/m2. Patients with hypertension were classified as those with a systolic blood pressure ≥140 mmHg and/or a diastolic blood pressure ≥90 mmHg, or those being treated with antihypertensive medication [Beaney et al., 2020]. The exclusion criteria of the above two groups were: (1) severe heart, liver or kidney failure or infection; (2) secondary hypertension caused by various disorders, such as chronic glomerulonephritis, pyelonephritis, diabetes nephropathy, renal artery stenosis, aortic stenosis, primary aldosteronism, pheochromocytoma, fingertip hypertrophy, or drug-related hypertension; (3) autoimmune diseases or connective tissue diseases, or malignant tumors; (4) being overweight or obese secondary to various other diseases such as thalamic diseases, hypothyroidism, Cushing syndrome, etc. The clinical data of the patients whose samples were used for transcriptome sequencing and qPCR are shown in Tables 1 and 2.
Table 1.
Clinical data of patients used for transcriptome sequencing
| Patient | Age, years | Weight, kg | Height, m | BMI, kg/m2 | Blood pressure, mmHg | Pulse, beats/min | Glucose, mmol/L |
|---|---|---|---|---|---|---|---|
| Normotensive 1 | 31 | 70 | 1.62 | 26.7 | 117/71 | 72 | 5.62 |
| Normotensive 2 | 40 | 80.5 | 1.65 | 29.6 | 113/71 | 80 | 5.66 |
| Normotensive 3 | 50 | 66.8 | 1.58 | 26.8 | 124/70 | 84 | 5.13 |
| Hypertensive 1 | 61 | 70.0 | 1.60 | 27.3 | 220/110 | 80 | 5.14 |
| Hypertensive 2 | 63 | 81.5 | 1.60 | 31.8 | 150/86 | 76 | 9.62 |
| Hypertensive 3 | 47 | 71.0 | 1.57 | 28.8 | 153/95 | 76 | 5.14 |
BMI, body mass index.
Table 2.
Clinical data of patients used for qPCR
| Clinical data | OW/OB normotensive individuals (n = 5) | OW/OB hypertensive individuals (n = 5) |
|---|---|---|
| Age, years | 52.6±9.6 | 55.4±11.9 |
| Weight, kg | 73.5±6.4 | 85.6±23.6 |
| BMI, kg/m2 | 29.1±2.3 | 31.4±6.8 |
| Heart rate, beats/min | 74.8±5.2 | 77.4±16.0 |
| SBP, mmHg | 120.0±14.9 | 146.6±7.9* |
| DBP, mmHg | 73.0±5.7 | 83.4±11.3 |
| MAP, mmHg | 88.7±8.0 | 104.5±9.6* |
| UA, µmol/L | 284.2±59.9 | 278.6±60.1 |
| TC, mmol/L | 5.2±1.1 | 5.1±0.8 |
| TG, mmol/L | 1.0±0.3 | 1.3±0.6 |
| LDL-C, mmol/L | 3.6±1.0 | 3.3±0.5 |
| HDL-C, mmol/L | 1.3±0.2 | 1.2±03 |
| HCY, µmol/L | 9.8±2.5 | 9.7±2.8 |
| Glu, mmol/L | 4.9±0.6 | 6.0±2.0 |
| Scr, µmol/L | 52.4±5.8 | 54.0±12.4 |
| ALT, U/L | 12.0±3.4 | 18.2±11.9 |
| AST, U/L | 16.6±4.8 | 21.6±8.6 |
All clinical data are shown as the mean ± standard deviation. BMI, body mass index; SBP, systolic blood pressure; DBP, diastolic blood pressure; MAP, mean arterial pressure; UA, uric acid; TC, total cholesterol; TG, triglyceride; LDL-C, low-density lipoprotein cholesterol; HDL-C, high-density lipoprotein cholesterol; HCY, homocysteine; Glu, glucose; Scr, serum creatinine; ALT, alanine aminotransferase; AST, aspartate aminotransferase.
Comparison between normotensive and hypertensive, p < 0.05.
Visceral Adipose Tissue Samples
During abdominal surgery, the surgeons collected approximately 200 mg of VAT, obtained from either the mesentery or greater omentum, from each individual. VAT samples were snap-frozen with liquid nitrogen and stored at −80°C.
RNA Extraction, Library Construction, and Transcriptome Sequencing
Total RNA was isolated from VAT samples of 6 OW/OB patients (3 hypertensive and 3 normotensive) using an RNeasy mini kit (Qiagen, Germany) according to the manufacturer's instructions. Poly-A-containing mRNAs were purified using poly-T oligo-attached magnetic beads and fragmented using divalent cations at 94°C for 8 min under high-pressure conditions. The cleaved RNA fragments were converted into first strand complementary DNA (cDNA) using reverse transcriptase and random primers. Second strand cDNA synthesis was conducted using DNA Polymerase I and RNase H. The cDNA segments were then subjected to end repair (single “A” base insertion and adapter ligation), purification, and PCR enhancement to produce the final cDNA library. To confirm the insert size and determine the molar concentration, RNA-seq libraries were analyzed using a Qubit® 2.0 Fluorometer (Life Technologies, USA) and an Agilent 2100 bioanalyzer (Agilent Technologies, USA). Clusters were produced from a library diluted to 10 pM using cBot and then sequenced using an Illumina NovaSeq 6000 system (Illumina, USA). Library creation and sequencing were performed by Shanghai Sinomics Corporation (Shanghai, China).
Preprocessing of RNA Sequencing Data
In order to obtain high-quality RNA-Seq data, RNA sequencing of the library of hypertensive and normotensive patients was performed using the Illumina NovaSeq 6000 platforms for paired-end sequencing. The raw data have been submitted to the GEO database under the accession number GSE217007 (https://www.ncbi.nlm.nih.gov/geo/query/acc.cgi?acc=GSE217007). The FastQC software was used to evaluate the quality of the raw data, and the fastp software was used to remove adapter sequences and low-quality reads to filter the raw data. After quality evaluation and sequence filtering of raw RNA sequencing data, clean reads were obtained. The clean reads were aligned to the known reference genome (human GRCh38) using the spliced mapping algorithm of Hisat2 software to obtain mapped reads. Gene expression was normalized to the fragments per kilobase of exon model per million mapped fragments (FPKM). That is to say that we first used StringTie software to compare and count the fragments in each gene segment, and then used the TMM (trimmed mean of M values) algorithm for normalization, followed by final calculation of the FPKM value of each gene. EdgeR was applied to calculate and analyze gene expression abundance.
Principal Component Analysis
Principal component analysis (PCA) was conducted to determine gene expression abundance using OmicShare tool (www.omicshare.com/tools).
Differentially Expressed Gene Analysis
Differentially expressed genes (DEGs) in VAT samples from hypertensive and normotensive patients were screened using the EdgeR package [Robinson et al., 2010]. DEGs with |log2 (fold change)| ≥ 1 and q < 0.05 were visualized using volcano maps and heatmaps. Heatmap and volcano maps were plotted by https://www.bioinformatics.com.cn, a free online platform for data analysis and visualization.
Gene Ontology and Kyoto Encyclopedia of Genes and Genomes Enrichment Analyses
The biological function of the DEGs was annotated using Gene Ontology (GO) enrichment analysis (http://geneontology.org/) for biological processes (BP), cellular components (CC), and molecular functions (MF). The possible signaling pathways related to these DEGs were analyzed using Kyoto Encyclopedia of Genes and Genomes (KEGG) enrichment analysis (http://www.genome.jp/kegg/) [Ashburner et al., 2000]. For GO and KEGG enrichment analyses, DEGs were annotation mapped to each term in the GO and KEGG databases, and the number of genes in each term was calculated. Comparing with all background genes in Homo sapiens species, hypergeometric test was used to find the terms that were significantly enriched in DEGs. Enrichment was calculated using Fisher's exact test or χ2 test. After the calculated p value was corrected by multiple hypothesis testing using q ≤ 0.05 as the threshold, GO terms that satisfied this condition were defined as those significantly enriched in DEGs. The enrichment results of differential genes were mapped by ggplot2.
Gene Set Enrichment Analysis
Gene Set Enrichment Analysis (GSEA) was performed to determine whether the enriched KEGG pathways differed significantly between hypertensive and normotensive patients [Subramanian et al., 2005]. All gene expression data were uploaded to https://cloud.oebiotech.com/task/detail/gsea--ttest/ according to the manufacturer's instructions. Important gene sets were identified as those with p < 0.05 and false discovery rate (FDR) < 0.25.
Protein-Protein Interaction Network Construction
A predicted Protein-Protein Interaction (PPI) network was constructed from the identified DEGs using the Search Tool for the Retrieval of Interacting Genes and database (STRING v11.5, https://string-db.org) [Szklarczyk et al., 2021], with a score of 0.4 as the cut-off criterion for network inclusion. The PPI network was visualized using Cytoscape software (version 3.7.2) [Shannon et al., 2003], and hub genes were analyzed using CytoHubba, which calculated maximum clique centrality (MCC).
Bioinformatics Analysis of Hub Genes
The top 10 hub genes were analyzed via the Metascape database (http://metascape.org/gp/index.html#/main/step1) [Zhou et al., 2019]. They were identified in the following two categories: TRRUST and PaGenBase. Terms with a p value cut-off of 0.01, a minimum overlap of 3, and a minimum enrichment factor of 1.5 were filtered out.
qRT-PCR
To confirm the transcriptome sequencing results, we performed qRT-PCR to verify the expression of the top 10 hub genes. Total RNA was extracted from 10 VAT samples (5 hypertensive and 5 normotensive) using TRIzol (Vazyme, Nanjing, China) according to the manufacturer's protocol. After the concentration had been verified using a NanoDrop spectrophotometer, total RNA was reverse transcribed into cDNA using HiScript III All-in-one RT SuperMix Perfect for qPCR (Vazyme, Nanjing, China) on a GeneAmp® PCR System 9700 (Applied Biosystems, USA). qRT-PCR was performed using ChamQ Universal SYBR qPCR Master Mix (Vazyme, Nanjing, China) with a StepOnePlus Real-Time PCR System (Applied Biosystems, USA). The primer sequences (Sangon Biotech, Shanghai, China) for these 10 hub genes are listed in Table 3. β-Actin (Sangon Biotech) was utilized as an internal control, and relative gene expression levels were determined using the 2−ΔΔCt method.
Table 3.
Primer sequences (5′→3′) verified using qRT-PCR
| Gene | Forward | Reverse |
|---|---|---|
| CD79A | TCTTCCTCCTCTTCCTGCTGTCTG | CGTTGGCGTTGTTGCTGCTATTG |
| CR2 | CTACTTCTGCGGTTCAGTGTCCAC | TCGGATTTGCTTGCTGCCCTTC |
| SELL | ACAAGGAGGACTGCGTGGAGATC | TTAGTTTGTGGCAGGCGTCATCG |
| CD22 | TGACCAAGGACCAGAGTGGGAAG | TGGAGGATCTGAACCGTGGAAGG |
| IL7R | AAAGGCTTCTGGAGTGAATGGAGTC | CCAAGATGACCAACAGAGCGACAG |
| CCR7 | GCTGTGGTCGTGGTCTTCATAGTC | AGGCGATGTTGAGTTGCTTACTGAG |
| TNFRSF13C | GCCCCTGGACAAGGTCATCATTC | GTGGGGTGGTTCCTGGGTCTTC |
| CXCR4 | TTCCTGCCCACCATCTACTCCATC | CCTGTACTTGTCCGTCATGCTTCTC |
| POU2AF1 | CTCCGCCACTCATCACCAATGTC | TGGAGGTGGGTAGTGTGGAAAGG |
| JAK3 | CAACATCTTCTCTCGCCAGTCAGAC | TCCCGCTCACATCCCATCATCC |
| NFKB1 | ATGGTGGTCGGCTTCGCAAAC | CGCCTCTGTCATTCGTGCTTCC |
| KLF2 | CGCCTCTGTCATTCGTGCTTCC | ATCGCACAGATGGCACTGGAATG |
| RELA | CCAGACCAACAACAACCCCTTCC | AAGCAGAGCCGCACAGCATTC |
Statistical Analysis
Statistical analysis was performed using GraphPad Prism (version 3.7.2) software, and all values were expressed as mean ± SD. ROC analysis was conducted through GraphPad Prism (version 3.7.2) software. Spearman correlation analysis was performed to evaluate the relationships between VAT CXCR4, IL7R, and CD22 expression and RELA. Statistical significance was analyzed using the Wilcoxon-Mann-Whitney test with a threshold of *p < 0.05 and **p < 0.01.
Results
Overview of Transcriptome Data between Hypertensive and Normotensive VATs
In order to investigate the transcriptome alterations in OW/OB patients with hypertension, we performed RNA sequencing analysis of VAT samples isolated from normotensive and hypertensive OW/OB subjects. The preprocessing of RNA sequencing data is shown in Table 4. This resulted in 62.8–71.8 million and 52.2–77.1 million raw reads, respectively. After filtering some unqualified reads with low overall quality score, sequencing primer sequences, and low terminal quality, we obtained 51.6–76.4 million and 62.2–71.0 million clean reads of transcriptome data from hypertensive and normotensive patients, accounting for 98.87–98.99% and 98.94–99.12% raw reads, respectively. The quality evaluation indicated that reads with Q30 were more than 94%. Next, we mapped the clean reads to a known reference genome (human GRCh38) using the Hisat2 software for every tissue sample. A total of 58.5–65.8 million and 47.9–70.0 million clean reads were aligned, with a mapping rate of 93.85–94.40% and 93.17–94.95%, respectively.
Table 4.
Transcriptome data statistical results
| Sample | Raw reads | Clean reads | Clean reads rate, % | Q30, % | Mapped reads | Mapping rate, % |
|---|---|---|---|---|---|---|
| Normotensive 1 | 70,759,396 | 69,958,966 | 98.87 | 94.12 | 63,573,053 | 93.85 |
| Normotensive 2 | 71,756,034 | 71,029,690 | 98.99 | 94.26 | 65,772,241 | 93.79 |
| Normotensive 3 | 62,810,380 | 62,154,280 | 98.96 | 94.24 | 58,532,419 | 94.40 |
| Hypertensive 1 | 71,938,044 | 71,248,460 | 99.04 | 94.41 | 67,009,500 | 94.95 |
| Hypertensive 2 | 77,142,388 | 76,463,378 | 99.12 | 94.46 | 69,999,116 | 93.66 |
| Hypertensive 3 | 52,186,016 | 51,632,156 | 98.94 | 94.09 | 47,915,761 | 93.17 |
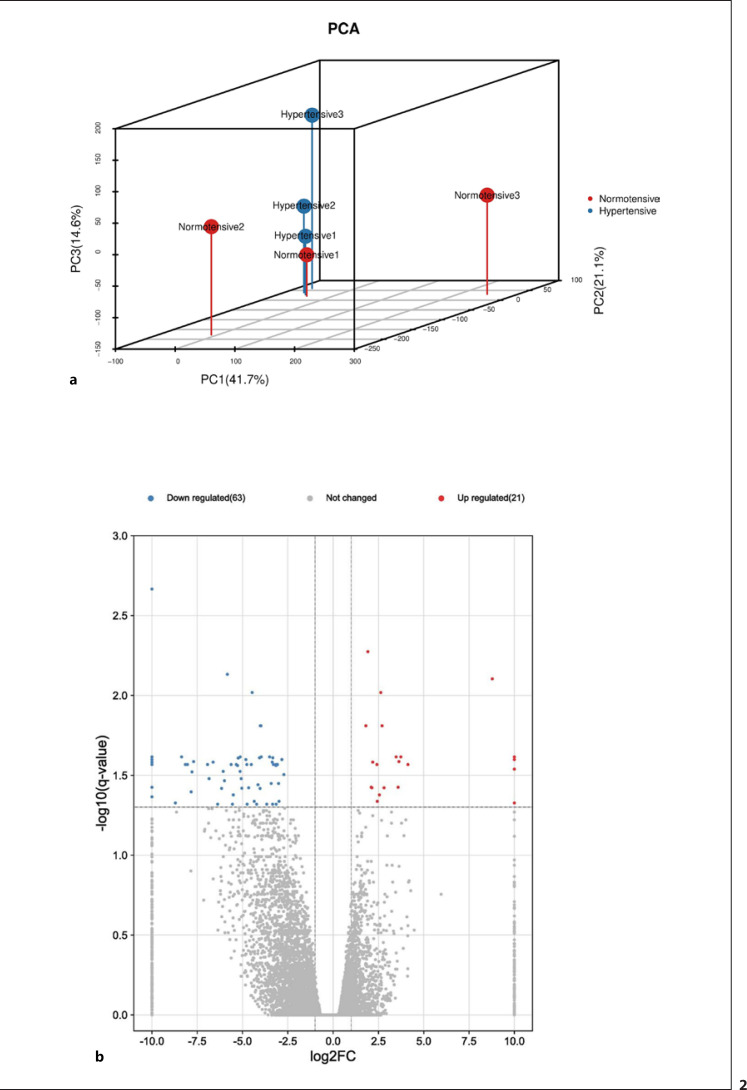
PCA was used to estimate the similarity in the gene expressed levels in VATs from different hypertensive patients. Based on the first PC (PC1) and the second PC (PC2), two-dimensional PCA results are shown in Figure 2a. Obviously, the PCA suggested that hypertensive samples exhibited different gene expression profiles compared with those of normotensive samples.
Fig. 2.
a PCA plot of RNA sequencing results. b Volcano plot of DEGs between VAT samples from patients with and without hypertension. Significantly upregulated genes are indicated in red, significantly downregulated genes are indicated in blue.
Gene Expression Varies in Hypertensive OW/OB Patients
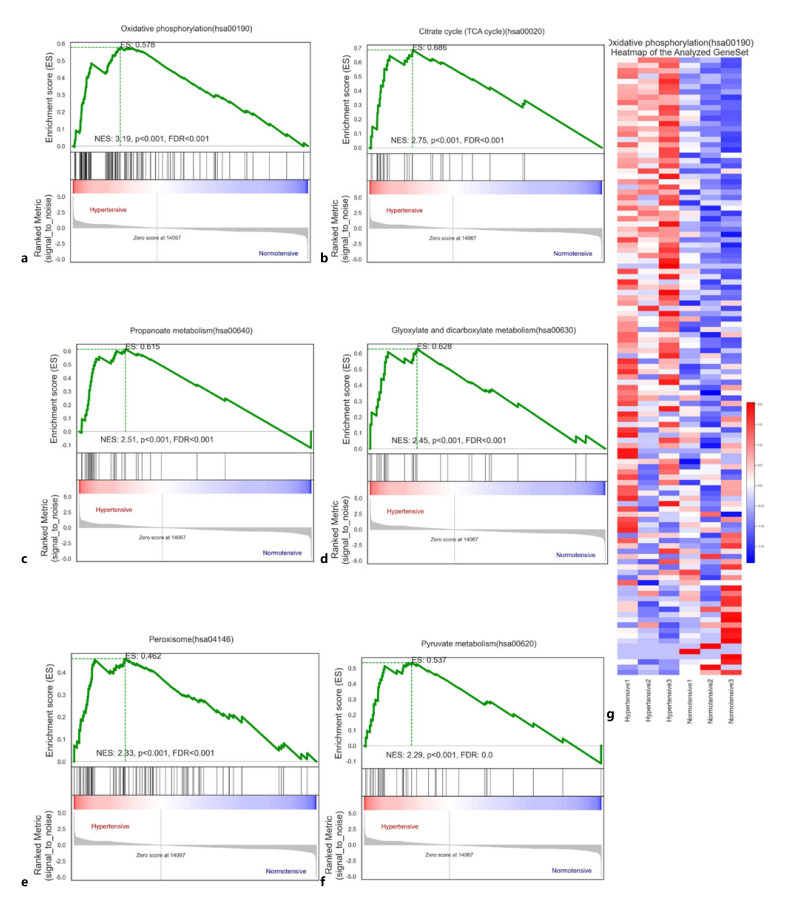
First, we performed GSEA on the gene expression data from VAT samples from OW/OB patients with and without hypertension. A total of 79/314 gene sets were upregulated in hypertensive patients, among which 51 were significantly enriched at FDR < 0.25, 33 were significantly enriched at p < 0.01, and 41 were significantly enriched at p < 0.05. In normotensive patients, 235/314 gene sets were upregulated, among which 124 were significantly enriched at FDR < 0.25, 67 were significantly enriched at p < 0.01, and 96 were significantly enriched at p < 0.05 (Table 5). Oxidative phosphorylation(hsa00190) was substantially enriched in hypertensive patients (enrichment score = 0.577941990625741; Fig. 3a), indicating that this process may play a vital role in the pathogenesis of hypertension. The top 6 enriched gene sets (Fig. 3a-f) were oxidative phosphorylation(hsa00190), citrate cycle (TCA cycle)(hsa00020), valine, leucine and isoleucine degradation(hsa00280), propanoate metabolism(hsa00640), glyoxylate and dicarboxylate metabolism(hsa00630), and peroxisome(hsa04146). Figure 3g and online supplementary Table 1 (for all online suppl. material, see www.karger.com/doi/10.1159/000528702) show the heat plot of oxidative phosphorylation(hsa00190). This indicates that the metabolic pathways associated with hypertension vary in OW/OB patients.
Table 5.
Statistical results of GSEA analysis for transcriptome sequencing dataset
| Phenotype | Proportion of upregulated gene sets | Number of gene sets enriched at FDR < 0.25 | Number of gene sets enriched at p < 0.01 | Number of gene sets enriched at p < 0.05 |
|---|---|---|---|---|
| Normotensive | 235/314 | 124 | 67 | 96 |
| Hypertensive | 79/314 | 51 | 33 | 41 |
Fig. 3.
a–f Gene set enrichment analysis (GSEA). a Oxidative phosphorylation (hsa00190). b Citrate cycle (TCA cycle) (hsa00020). c Propanoate metabolism (hsa00640). d Glyoxylate and dicarboxylate metabolism (hsa00630). e Peroxisome (hsa04146). f Heat plot of oxidative phosphorylation (hsa00190).
DEGs Are Associated with Immunological Genes and Pathways in Hypertensive OW/OB Patients
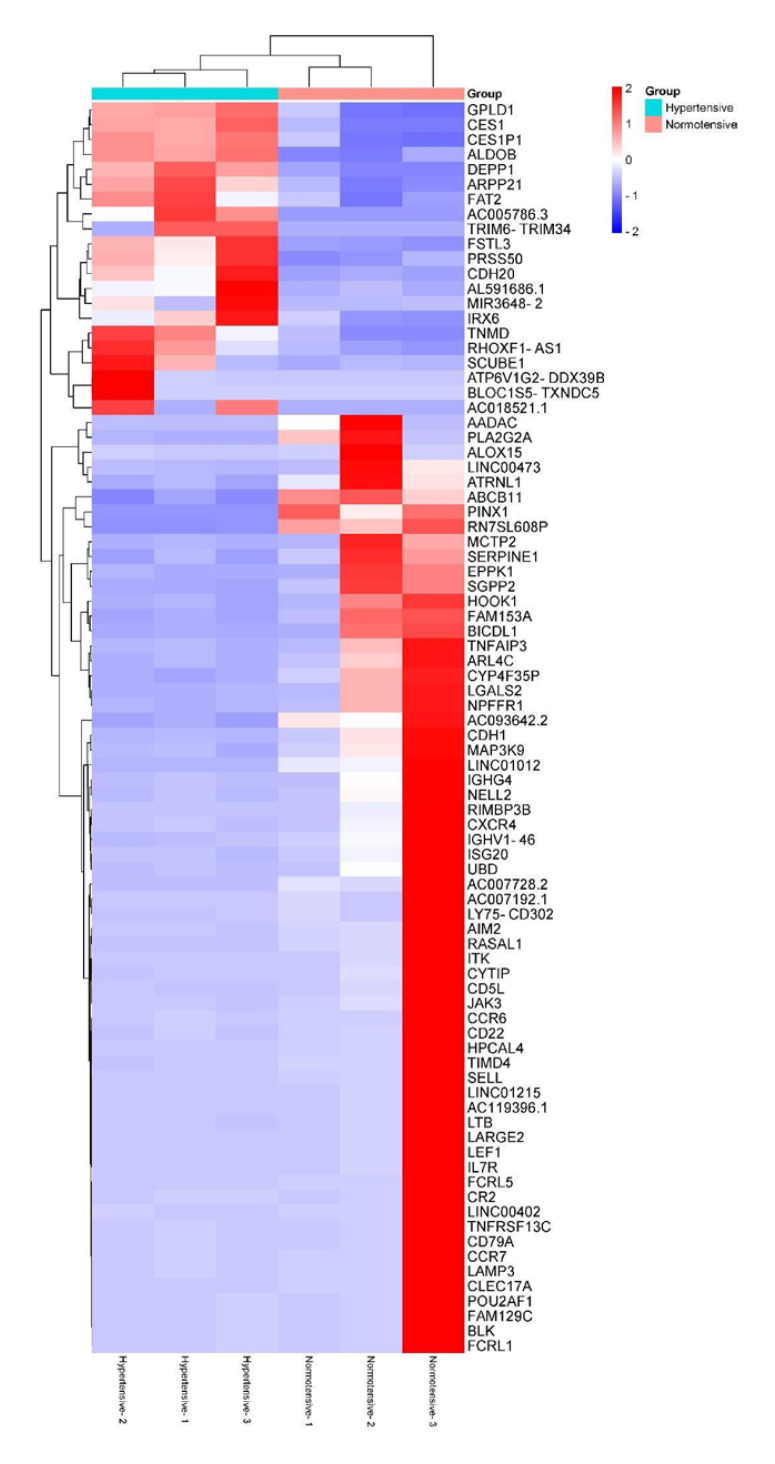
Next, we used VAT transcriptome sequencing data to identify 84 DEGs (|log2 (fold change)| ≥ 1 and q < 0.05) in hypertensive patients. The expression levels of these DEGs were displayed as a volcano plot and heat map (Fig. 2b, 4).
Fig. 4.
Heat map of hierarchical clustering of the DEGs in hypertensive (Hypertensive-1, Hypertensive-2, and Hypertensive-3) and normotensive (Normotensive-1, Normotensive-2, and Normotensive-3) patients. Significantly upregulated genes are indicated in red; significantly downregulated genes are indicated in blue.
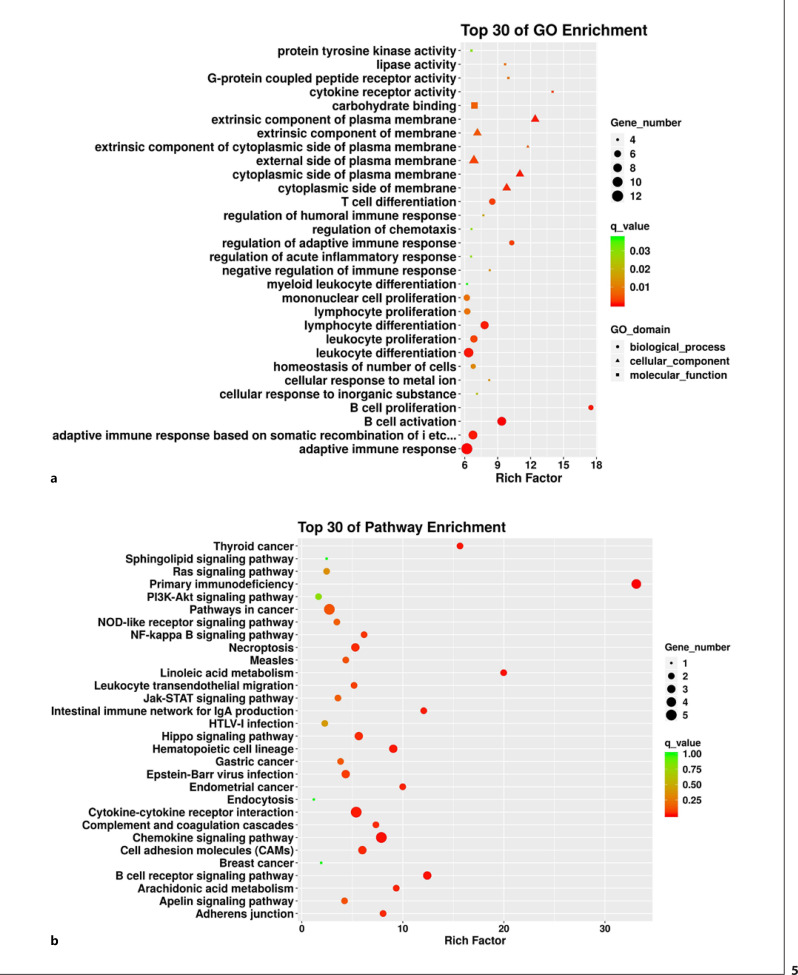
To better understand the functions of these DEGs, functional enrichment analysis was conducted to identify enriched GO terms, with the top 30 GO terms shown in Figure 5a and Table 6. The BPs were mainly enriched for T-cell differentiation, regulation of the adaptive immune response, monocyte proliferation, lymphocyte proliferation and differentiation, leukocyte proliferation and differentiation, B-cell activation and proliferation, and the adaptive immune response (q < 0.05). The enriched CCs included extrinsic membrane components, the cytoplasmic side of the membrane, the cytoplasmic side of the plasma membrane, extrinsic plasma membrane components, and extrinsic components of the cytoplasmic side of the plasma membrane (q < 0.05). Meanwhile, the MFs were primarily enriched for carbohydrate binding, lipase activity, G-protein coupled peptide receptor activity, and cytokine receptor activity (q < 0.05).
Fig. 5.
Functional enrichment analysis of DEGs. a Top 30 GO terms annotated from three categories: biological functions, cellular components, and molecular functions. b Top 30 KEGG terms.
Table 6.
Top 30 list of GO enrichment analysis of DEGs
| Type | GO ID | GO term | Rich factor | Q value | DEG number |
|---|---|---|---|---|---|
| BP | GO:0042100 | B-cell proliferation | 17.49919407 | 0.000735053 | 5 |
| GO:0002819 | Regulation of adaptive immune response | 10.28077652 | 0.002903619 | 5 | |
| GO:0042113 | B-cell activation | 9.369821634 | 0.000181003 | 9 | |
| GO:0030217 | T-cell differentiation | 8.50822884 | 0.002786617 | 6 | |
| GO:0050777 | Negative regulation of immune response | 8.27634839 | 0.013775852 | 4 | |
| GO:0071248 | Cellular response to metal ion | 8.224621212 | 0.013875674 | 4 | |
| GO:0030098 | Lymphocyte differentiation | 7.809729341 | 0.000772687 | 8 | |
| GO:0002920 | Regulation of humoral immune response | 7.695552011 | 0.017612228 | 4 | |
| GO:0071241 | Cellular response to inorganic substance | 7.113185913 | 0.022807751 | 4 | |
| GO:0070661 | Leukocyte proliferation | 6.833513173 | 0.003159771 | 7 | |
| GO:0048872 | Homeostasis of number of cells | 6.769235566 | 0.011896996 | 5 | |
| GO:0002460 | Adaptive immune response based on somatic recombination of immune receptors | ||||
| built from immunoglobulin superfamily domains | 6.744564092 | 0.000733628 | 9 | ||
| GO:0050920 | Regulation of chemotaxis | 6.612760774 | 0.029939471 | 4 | |
| GO:0002673 | Regulation of acute inflammatory response | 6.57969697 | 0.029607973 | 4 | |
| GO:0002521 | Leukocyte differentiation | 6.351058851 | 0.00065514 | 10 | |
| GO:0046651 | Lymphocyte proliferation | 6.226842558 | 0.008473933 | 6 | |
| GO:0002573 | Myeloid leukocyte differentiation | 6.207261292 | 0.037080422 | 4 | |
| GO:0002250 | Adaptive immune response | 6.189295268 | 0.000240912 | 13 | |
| GO:0032943 | Mononuclear cell proliferation | 6.187802793 | 0.008552756 | 6 | |
| CC | GO:0019897 | Extrinsic component of plasma membrane | 12.41452258 | 0.000759382 | 6 |
| GO:0031234 | Extrinsic component of cytoplasmic side of plasma membrane | 11.74945887 | 0.005250484 | 4 | |
| GO:0009898 | Cytoplasmic side of plasma membrane | 11.02742509 | 0.000809898 | 6 | |
| GO:0098562 | Cytoplasmic side of membrane | 9.820443238 | 0.001538287 | 6 | |
| GO:0019898 | Extrinsic component of membrane | 7.151844532 | 0.005135113 | 6 | |
| GO:0009897 | External side of plasma membrane | 6.833513173 | 0.003159771 | 7 | |
| MF | GO:0004896 | Cytokine receptor activity | 13.99935525 | 0.002791508 | 4 |
| GO:0008528 | G-protein coupled peptide receptor activity | 9.969237833 | 0.008435029 | 4 | |
| GO:0016298 | Lipase activity | 9.676024955 | 0.008858522 | 4 | |
| GO:0030246 | Carbohydrate binding | 6.877732024 | 0.006031352 | 6 | |
| GO:0004713 | Protein tyrosine kinase activity | 6.612760774 | 0.029939471 | 4 |
To further elucidate the signaling pathways that may be associated with the identified DEGs, KEGG pathway enrichment analysis was conducted. The enriched KEGG pathways included chemokine signaling, cytokine-cytokine receptor interaction, primary immunodeficiency, B-cell receptor signaling, and cell adhesion molecules (q < 0.05, Fig. 5b; Table 7). This observation suggests that several genes are associated with immunological functions and pathways in hypertensive OW/OB patients.
Table 7.
Top 30 list of KEGG enrichment analysis of DEGs
| Pathway ID | Pathway | Rich factor | Q value | DEG, n |
|---|---|---|---|---|
| hsa05340 | Primary immunodeficiency | 33.10628571 | 5.18E-05 | 4 |
| hsa00591 | Linoleic acid metabolism | 19.97793103 | 0.007522669 | 2 |
| hsa05216 | Thyroid cancer | 15.65837838 | 0.012205217 | 2 |
| hsa00515 | Mannose type O-glycan biosynthesis | 12.59478261 | 1 | 1 |
| hsa04662 | B cell receptor signaling pathway | 12.41485714 | 0.008566184 | 3 |
| hsa04672 | Intestinal immune network for IgA production | 12.07 | 0.016120776 | 2 |
| hsa00592 | Alpha-linolenic acid metabolism | 11.5872 | 1 | 1 |
| hsa00563 | Glycosylphosphatidylinositol (GPI)-anchor biosynthesis | 11.5872 | 1 | 1 |
| hsa05213 | Endometrial cancer | 9.988965517 | 0.024545121 | 2 |
| hsa00030 | Pentose phosphate pathway | 9.656 | 1 | 1 |
| hsa00590 | Arachidonic acid metabolism | 9.344516129 | 0.026667279 | 2 |
| hsa04640 | Hematopoietic cell lineage | 9.0525 | 0.013925619 | 3 |
| hsa00051 | Fructose and mannose metabolism | 8.778181818 | 1 | 1 |
| hsa04520 | Adherens junction | 8.046666667 | 0.033794659 | 2 |
| hsa04062 | Chemokine signaling pathway | 7.87173913 | 0.007793985 | 5 |
| hsa04610 | Complement and coagulation cascades | 7.333670886 | 0.037485982 | 2 |
| hsa04216 | Ferroptosis | 7.242 | 1 | 1 |
| hsa04975 | Fat digestion and absorption | 7.065365854 | 1 | 1 |
| hsa05219 | Bladder cancer | 7.065365854 | 1 | 1 |
| hsa00565 | Ether lipid metabolism | 6.437333333 | 1 | 1 |
| hsa04064 | NF-kappa B signaling pathway | 6.163404255 | 0.052885906 | 2 |
| hsa00600 | Sphingolipid metabolism | 6.163404255 | 1 | 1 |
| hsa04514 | Cell adhesion molecules (CAMs) | 5.99337931 | 0.033774004 | 3 |
| hsa04390 | Hippo signaling pathway | 5.643116883 | 0.03533281 | 3 |
| hsa04060 | Cytokine-cytokine receptor interaction | 5.384386617 | 0.015985422 | 5 |
| hsa04217 | Necroptosis | 5.29902439 | 0.038151151 | 3 |
| hsa05130 | Pathogenic Escherichia coli infection | 5.266909091 | 1 | 1 |
| hsa04670 | Leukocyte transendothelial migration | 5.172857143 | 0.075462467 | 2 |
| hsa05217 | Basal cell carcinoma | 4.598095238 | 1 | 1 |
PPI Network Construction
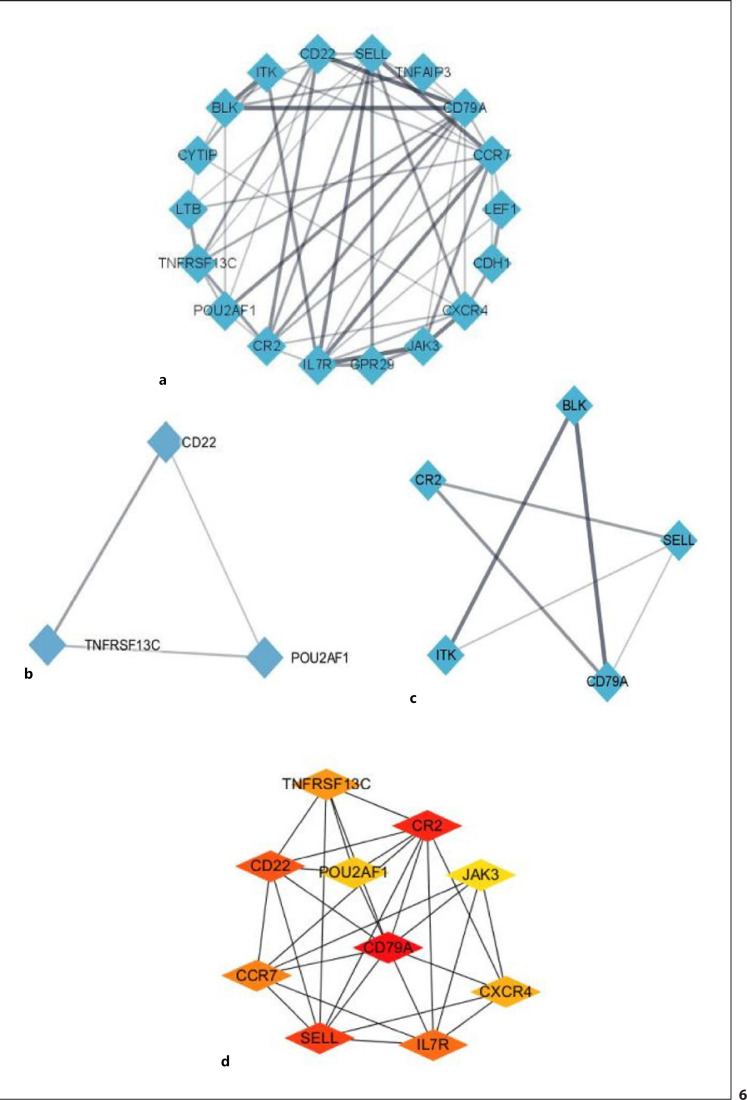
To identify key genes with potential research significance, the 84 DEGs were uploaded to the STRING database to construct a PPI network with a total score >0.4 (Fig. 6a). Significant modules were detected using the MCODE Cytoscape plug-in, which identified 126 edges, 29 nodes, and 2 modules. Module 1 received a score of 3 and consisted of 3 nodes and 6 edges, which included POU2AF1, CD22, and TNFRSF13C. Module 2 received a score of 3 and contained 5 nodes and 12 edges with BLK, CR2, ITK, SELL, and CD79A. The top 10 hub genes were selected from the PPI network using the MCC algorithm in CytoHubba (Fig. 6d) and included CD79A, CR2, SELL, CD22, IL7R, CCR7, TNFRSF13C, CXCR4, POU2AF1, and JAK3.
Fig. 6.
PPI network analysis of DEGs in VAT from hypertensive OW/OB adults. a Edges represent specific and meaningful PPIs. b, c Two significant modules identified using the Cytoscape MCODE plug-in. d Top 10 hub genes identified using cytoHubba in Cytoscape.
Hub Gene Verification via qRT-PCR
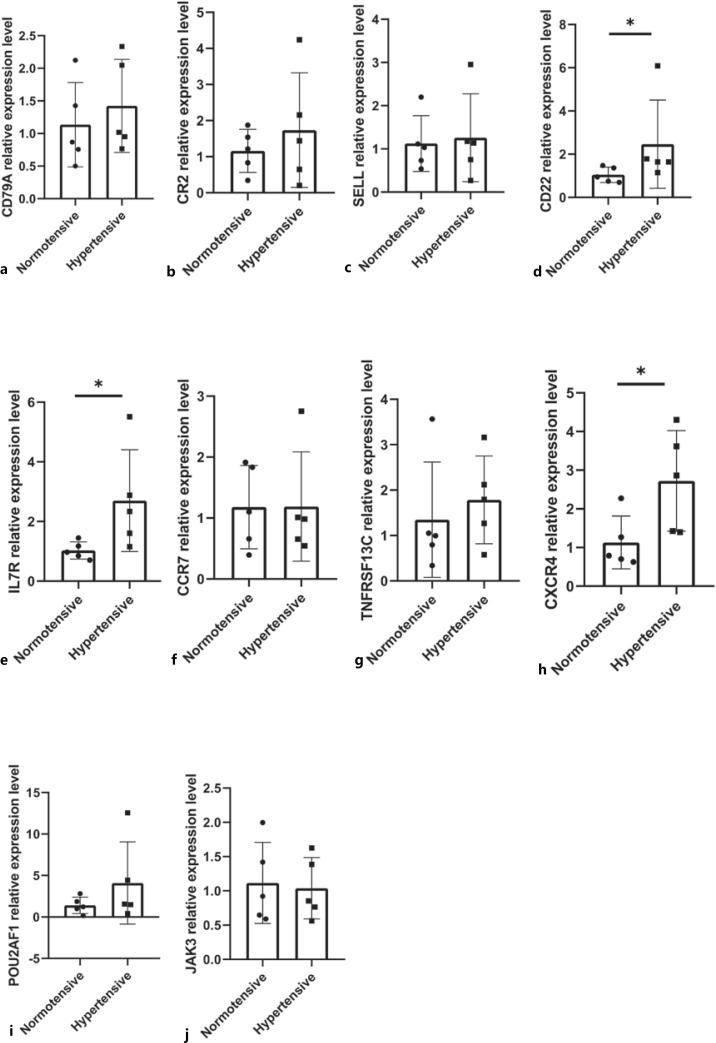
The expression of these hub genes was verified by performing qRT-PCR on the total RNA extracted from 9 VAT samples. Significant differences were observed in the expression of CXCR4, CD22, and IL7R between hypertensive and normotensive patients (p < 0.05; Fig. 7).
Fig. 7.
a−j qRT-PCR verification of the top 10 hub genes in VAT from hypertensive OW/OB adults. * p < 0.05.
Bioinformatics Analysis of Hub Genes
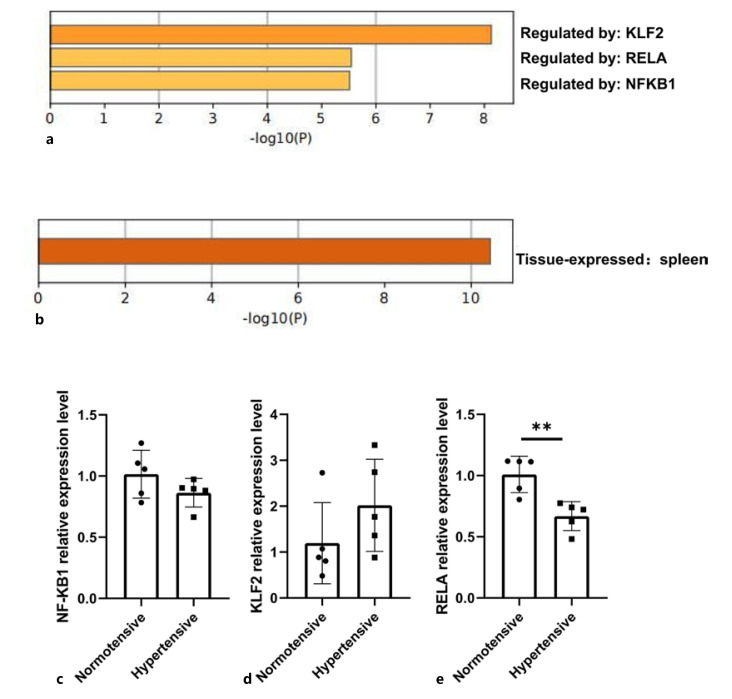
TRRUST database analysis also revealed that the hub genes were mainly regulated by the transcription factors KLF2, RELA, and NF-KB1 (Fig. 8a), while tissue feature enrichment analysis of the PaGenBase database indicated that the hub genes were expressed in the spleen (Fig. 8b). To conclude, these key genes involved in hypertensive OW/OB patients might be related to immunological functions of the spleen.
Fig. 8.
Bioinformatics analysis of key genes and qRT-PCR verification of transcription factors. a TRRUST enrichment analysis. b PaGenBase enrichment analysis. c−e qRT-PCR verification of 3 transcription factors (including NFKB1, KLF2, and RELA).
Transcription Factor Verification via qRT-PCR
The expression of 3 transcription factors (including NFKB1, KLF2 and RELA) were measured by qRT-PCR in visceral tissue samples. As shown in Figure 8c-e, we found that the expression of KLF2 was upregulated, whereas that of RELA and NFKB1 was downregulated. The alteration of RELA expression in hypertensive patients was statistically significant. However, the changes in NFKB1 and KLF2 expression in hypertensive patients were not statistically significant.
ROC Analysis of CXCR4, IL7R, and CD22
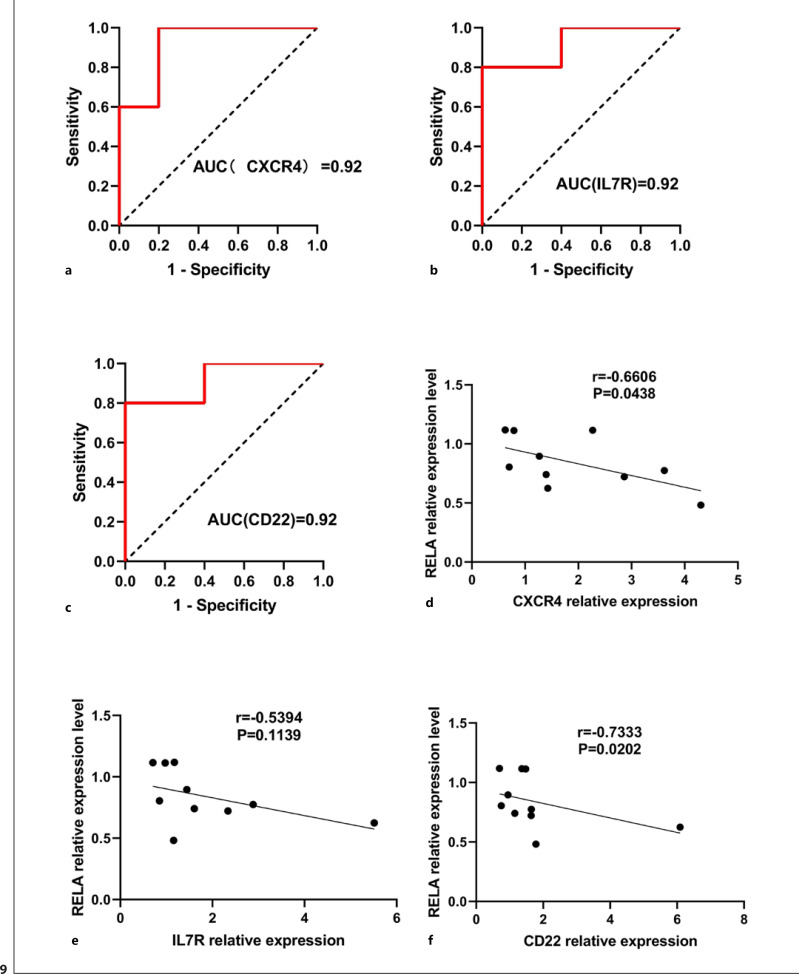
To verify the predictive value of CXCR4, IL7R, and CD22 in hypertensive individuals, we made ROC curves. As shown in Figure 9a, the AUC for CXCR4 in normotensive and hypertensive individuals was 0.92 [95% confidence interval (CI), 0.7385–1.0000; p = 0.0283]. As shown in Figure 9b, the AUC for IL7R in normotensive and hypertensive individuals was 0.92 [95% CI, 0.7385–1.0000; p = 0.0283]. As shown in Figure 9c, the AUC for CD22 in normotensive and hypertensive individuals was 0.92 [95% CI, 0.7385–1.0000; p = 0.0283]. As can be seen, CXCR4, IL7R, and CD22 have a high predictive value for hypertension under OW/OB state.
Fig. 9.
ROC curves and Spearman correlation. a–c ROC curves of CXCR4 (a), IL7R (b), and CD22 (c) for discriminating hypertensive from normotensive patients. d–f Spearman correlation between CXCR4 and RELA (d), IL7R and RELA (e), and CD22 and RELA (f).
Spearman Correlation of CXCR4, IL7R, and CD22 with RELA
As shown in Figure 9d, correlation analysis results showed that CXCR4 relative expression level was significantly positive related to RELA (r = 0.6606, p = 0.0438). Correlation analysis results showed that CD22 relative expression level was significantly positive related to RELA (r = 0.7333, p = 0.0202) (Fig. 9f). However, there was significantly no correlation between IL7R relative expression level and RELA. Therefore, CXCR4 and CD22 were regulated by RELA in hypertensive patients under OW/OB state.
Discussion
VAT expresses the renin-angiotensin system (RAS), which is involved in obesity-related complications such as arterial hypertension [Pantanetti et al., 2004]. An observational study has demonstrated that a higher body mass index and VAT are closely linked to the incidence of hypertension [Chandra et al., 2014]. Meanwhile, it has been reported that VAT increases aldosterone levels, which play a key role in obesity-related hypertension [Jansen et al., 2010], and that VAT accumulation can cause chronic inflammation and metabolic disorders that are involved in hypertension [Dutheil et al., 2018]. Although VAT and gene-level mechanisms are known to play a critical role in the development of hypertension of OW/OB patients, the detailed genetic basis of hypertension in the VAT of OW/OB patients remains largely unclear.
In this study, we identified a total of 84 DEGs between VAT samples from OW/OB patients with and without hypertension, among which 21 were upregulated and 63 were downregulated. We subsequently identified 2 key modules and 10 hub genes in the PPI network of these DEGs, which included CD79A, CR2, SELL, CD22, IL7R, CCR7, TNFRSF13C, CXCR4, POU2AF1, and JAK3. The results of qRT-PCR showed that significant differences were observed in the expression of CD22, CXCR4, and IL7R between hypertensive and normotensive patients. IL7R (interleukin 7 receptor) is a critical gene that stimulates the formation of tertiary lymphoid organs in mice with atherosclerotic arteries [Zhang et al., 2019]. CXCR4 (C-X-C motif chemokine receptor 4) blockade could advance tissue repair after myocardial infarction [Wang et al., 2019]. Moreover, recent studies have indicated that CXCR4 is associated with vascular smooth muscle α 1-adrenergic receptors (ARS) interactions that regulate blood pressure [Tripathi et al., 2015]. Clinical studies have shown that CXCR4 levels in the peripheral blood of patients with chronic complete coronary occlusion correlate positively with the existence and range of collateral circulation in coronary angiography [Yang et al., 2016]. CXCR4 is also related to the development of atherosclerotic plaques and idiopathic pulmonary hypertension [Yang et al., 2021; Zhao et al., 2021], while baseline CXCR4 expression is considerably lower in early endothelial progenitor cells from prehypertensive patients [Shao et al., 2018]. CD22+ B cells are found in atherosclerotic plaques from hypercholesterolemic apolipoprotein E knockout mice [Zhou and Hansson, 1999] and CD22+ B lymphocytes have been discovered in inflammatory abdominal aortic aneurysms [Pasquinelli et al., 1993].
Functional enrichment analysis of these DEGs demonstrated that immunological genes and pathways were involved in hypertensive OW/OB adults, suggesting that immune system regulation may play a crucial role in the development of hypertension. Recent studies have pointed out that the regulation of immune response can reduce the severity of elevated blood pressure and end organ damage in hypertension [Wenzel et al., 2021].
Analysis of the TRRUST database revealed that NF-KB1, RELA, and KLF2 are important transcription factors of the hub genes identified in this study. Previous reports have shown that NF-κB inhibition could moderate hypertension and cardiac hypertrophy by decreasing the levels of pro-inflammatory cytokines and oxidative stress [Yu et al., 2015]. In addition, Kruppel-like factor 2 (KLF2) upregulation in glomerular cells has been shown to exert reno-protective effects against hypertensive nephropathy [Bae et al., 2022]. Notably, enrichment analysis based on the PaGenBase database demonstrated that the top 10 hub genes were enriched in the spleen. Therefore, the occurrence and development of hypertension may be related to the function of the spleen. The recruitment of macrophages from the spleen to the heart and aorta may lead to angiotensin II-induced cardiac fibrosis and hypertension [Wang et al., 2017]. Multifaceted enrichment analysis of hub genes could therefore improve our understanding of the pathogenesis of hypertension in OW/OB adults.
Despite our novel findings, this study has some limitations. Firstly, the sample size for human VAT was small; therefore, future studies should be conducted with a larger sample size to verify our research results. In addition, this study did not explore the specific molecular mechanism underlying hypertension, which is necessary to further elucidate the pathogenesis of hypertension in OW/OB individuals. What is more, since this study only included female OW/OB patients, the impact of gender differences should be explored further in the future. Finally, this study is limited by insufficient age matching.
Conclusion
In this study, transcriptome sequencing and subsequent bioinformatic methods were applied to investigate the pathogenesis and molecular mechanism of hypertension in OW/OB adults. IL7R, CD22, and CXCR4 were identified as key genes in VAT from hypertensive OW/OB adults. Furthermore, we found that the occurrence of hypertension in OW/OB individuals may be associated with the function of the spleen through hub genes. CXCR4 and CD22 were mainly regulated by the transcription factor RELA. Taken together, these results improve our understanding of the role of VAT in hypertension in OW/OB individuals.
Statement of Ethics
The Ethics Committee of Yantai Yuhuangding Hospital (Yantai City, China) approved this research (2022-94). All patients provided their written informed consent before undergoing abdominal surgery. This research was conducted in accordance with the principles of the Declaration of Helsinki.
Conflict of Interest Statement
The authors report no conflicts of interest in this work.
Funding Sources
This work was supported by Key Research and Development Program of Shandong Province (No. 2019GSF108142); Science and Technology Program of Yantai City (No. 2021MSGY042 and No. 2021MSGY044), and Youth Research Foundation of Yuhuangding Hospital (No. 2021-03).
Author Contributions
Clinical samples were collected by Lanlan Liao, Lihui Zhang, and Hongping Chen. Lanlan Liao, Jun Yang, and Zhen Shi carried out bioinformatics analysis of the differentially expressed genes and contributed to RNA library construction, sequencing, and validation of differentially expressed genes. Lanlan Liao, Da Teng, and Bowen Xu performed the GSEA analysis of all genes and enrichment analysis of differentially expressed genes. Lanlan Liao, Haibin Dong, and Wenjuan Jia constructed the PPI network and performed bioinformatics analysis of the key genes. Lanlan Liao, Jun Yang, Lei Gong, Chunxiao Wang, Lin Zhong, and Zhen Shi designed and supervised qPCR experiments and part of the bioinformatics analysis and participated in manuscript writing. All authors read and approved the final manuscript.
Data Availability Statement
All data generated or analyzed during this study are included in this article and its online supplementary material files. Further inquiries can be directed to the corresponding author.
Supplementary Material
Supplementary data
Supplementary data
Acknowledgments
We thank the staff of Shanghai Sinomics Corporation for helpful suggestion on bioinformatics analysis.
Funding Statement
This work was supported by Key Research and Development Program of Shandong Province (No. 2019GSF108142); Science and Technology Program of Yantai City (No. 2021MSGY042 and No. 2021MSGY044), and Youth Research Foundation of Yuhuangding Hospital (No. 2021-03).
References
- 1.Alé A, Zhang Y, Han C, Cai D. Obesity-associated extracellular mtDNA activates central TGFβ pathway to cause blood pressure increase. Am J Physiol Endocrinol Metab. 2017;312((3)):E161–E174. doi: 10.1152/ajpendo.00337.2016. [DOI] [PMC free article] [PubMed] [Google Scholar]
- 2.Ashburner M, Ball CA, Blake JA, Botstein D, Butler H, Cherry JM, et al. Gene ontology: tool for the unification of biology. The Gene Ontology Consortium. Nat Genet. 2000;25((1)):25–29. doi: 10.1038/75556. [DOI] [PMC free article] [PubMed] [Google Scholar]
- 3.Bae E, Yu MY, Moon JJ, Kim JE, Lee S, Han SW, et al. Renoprotective effect of KLF2 on glomerular endothelial dysfunction in hypertensive nephropathy. Cells. 2022;11((5)):762. doi: 10.3390/cells11050762. [DOI] [PMC free article] [PubMed] [Google Scholar]
- 4.Beaney T, Schutte AE, Stergiou GS, Borghi C, Burger D, Charchar F, et al. May measurement month 2019: the global blood pressure screening campaign of the International Society of Hypertension. Hypertension. 2020;76((2)):333–341. doi: 10.1161/HYPERTENSIONAHA.120.14874. [DOI] [PubMed] [Google Scholar]
- 5.Blaj S, Stanciu S, Jurcut C, Ciobîcă L. Hypertension in obese patients: a dysmetabolic hypertension with a possible adipocyte dysfunction mechanism. Rom J Intern Med. 2003;41((2)):103–111. [PubMed] [Google Scholar]
- 6.Chandra A, Neeland IJ, Berry JD, Ayers CR, Rohatgi A, Das SR, et al. The relationship of body mass and fat distribution with incident hypertension: observations from the Dallas Heart Study. J Am Coll Cardiol. 2014;64((10)):997–1002. doi: 10.1016/j.jacc.2014.05.057. [DOI] [PubMed] [Google Scholar]
- 7.Deji N, Kume S, Araki Si, Isshiki K, Araki H, Chin-Kanasaki M, et al. Role of angiotensin II-mediated AMPK inactivation on obesity-related salt-sensitive hypertension. Biochem Biophys Res Commun. 2012;418((3)):559–564. doi: 10.1016/j.bbrc.2012.01.070. [DOI] [PubMed] [Google Scholar]
- 8.Dutheil F, Gordon BA, Naughton G, Crendal E, Courteix D, Chaplais E, et al. Cardiovascular risk of adipokines: a review. J Int Med Res. 2018;46((6)):2082–2095. doi: 10.1177/0300060517706578. [DOI] [PMC free article] [PubMed] [Google Scholar]
- 9.Ge J, Li J, Yu H, Hou B. Hypertension is an independent predictor of multivessel coronary artery disease in young adults with acute coronary syndrome. Int J Hypertens. 2018;2018:7623639. doi: 10.1155/2018/7623639. [DOI] [PMC free article] [PubMed] [Google Scholar]
- 10.Gou J, Wu H. Secular trends of population attributable risk of overweight and obesity for hypertension among Chinese adults from 1991 to 2011. Sci Rep. 2021;11((1)):6371. doi: 10.1038/s41598-021-85794-2. [DOI] [PMC free article] [PubMed] [Google Scholar]
- 11.Hunter PG, Chapman FA, Dhaun N. Hypertension: current trends and future perspectives. Br J Clin Pharmacol. 2021;87((10)):3721–3736. doi: 10.1111/bcp.14825. [DOI] [PubMed] [Google Scholar]
- 12.Jansen PM, Danser JAH, Spiering W, van den Meiracker AH. Drug mechanisms to help in managing resistant hypertension in obesity. Curr Hypertens Rep. 2010;12((4)):220–225. doi: 10.1007/s11906-010-0123-5. [DOI] [PMC free article] [PubMed] [Google Scholar]
- 13.Lu SC, Akanji AO. Leptin, obesity, and hypertension: a review of pathogenetic mechanisms. Metab Syndr Relat Disord. 2020;18((9)):399–405. doi: 10.1089/met.2020.0065. [DOI] [PubMed] [Google Scholar]
- 14.Naccache S, Ben Kilani M, Tlili R, Ben Ameur Y, Boujnah MR. Atrial fibrillation and hypertension: state of the art. Tunis Med. 2017;95((7)):455–460. [PubMed] [Google Scholar]
- 15.Naguib YM, Samaka RM, Rizk MS, Ameen O, Motawea SM. Countering adipose tissue dysfunction could underlie the superiority of telmisartan in the treatment of obesity-related hypertension. Cardiovasc Diabetol. 2021;20((1)):70. doi: 10.1186/s12933-021-01259-w. [DOI] [PMC free article] [PubMed] [Google Scholar]
- 16.Natsis M, Antza C, Doundoulakis I, Stabouli S, Kotsis V. Hypertension in obesity: novel insights. Curr Hypertens Rev. 2020;16((1)):30–36. doi: 10.2174/1573402115666190415154603. [DOI] [PubMed] [Google Scholar]
- 17.Pantanetti P, Garrapa GGM, Mantero F, Boscaro M, Faloia E, Venarucci D. Adipose tissue as an endocrine organ? A review of recent data related to cardiovascular complications of endocrine dysfunctions. Clin Exp Hypertens. 2004;26((4)):387–398. doi: 10.1081/ceh-120034142. [DOI] [PubMed] [Google Scholar]
- 18.Pasquinelli G, Preda P, Gargiulo M, Vici M, Cenacchi G, Stella A, et al. An immunohistochemical study of inflammatory abdominal aortic aneurysms. J Submicrosc Cytol Pathol. 1993;25((1)):103–112. [PubMed] [Google Scholar]
- 19.Rethy L, Shah NS, Paparello JJ, Lloyd-Jones DM, Khan SS. Trends in hypertension-related cardiovascular mortality in the United States, 2000 to 2018. Hypertension. 2020;76((3)):e23–e25. doi: 10.1161/HYPERTENSIONAHA.120.15153. [DOI] [PMC free article] [PubMed] [Google Scholar]
- 20.Rigo D, Orias M. Hypertension and kidney disease progression. Clin Nephrol. 2020;93((1)):103–107. doi: 10.5414/CNP92S118. [DOI] [PubMed] [Google Scholar]
- 21.Robinson MD, McCarthy DJ, Smyth GK. edgeR: a Bioconductor package for differential expression analysis of digital gene expression data. Bioinformatics. 2010;26((1)):139–140. doi: 10.1093/bioinformatics/btp616. [DOI] [PMC free article] [PubMed] [Google Scholar]
- 22.Rosolová H. How to treat arterial hypertension in obese patients? Vnitr Lek. 2020;66((8)):490–493. [PubMed] [Google Scholar]
- 23.Shannon P, Markiel A, Ozier O, Baliga NS, Wang JT, Ramage D, et al. Cytoscape: a software environment for integrated models of biomolecular interaction networks. Genome Res. 2003;13((11)):2498–2504. doi: 10.1101/gr.1239303. [DOI] [PMC free article] [PubMed] [Google Scholar]
- 24.Shao YJ, Tao J, Yu BB, Meng D, Yang XL, Sun JP, et al. Berberine-promoted CXCR4 expression accelerates endothelial repair capacity of early endothelial progenitor cells in persons with prehypertension. Chin J Integr Med. 2018;24((12)):897–904. doi: 10.1007/s11655-018-2568-3. [DOI] [PubMed] [Google Scholar]
- 25.Soenarta AA, Buranakitjaroen P, Chia YC, Chen CH, Nailes J, Hoshide S, et al. An overview of hypertension and cardiac involvement in Asia: focus on heart failure. J Clin Hypertens. 2020;22((3)):423–430. doi: 10.1111/jch.13753. [DOI] [PMC free article] [PubMed] [Google Scholar]
- 26.Subramanian AA, Tamayo P, Mootha VK, Mukherjee S, Ebert BL, Gillette MA, et al. Gene set enrichment analysis: a knowledge-based approach for interpreting genome-wide expression profiles. Proc Natl Acad Sci U S A. 2005;102((43)):15545–50. doi: 10.1073/pnas.0506580102. [DOI] [PMC free article] [PubMed] [Google Scholar]
- 27.Szklarczyk D, Gable AL, Nastou KC, Lyon D, Kirsch R, Pyysalo S, et al. The STRING database in 2021: customizable protein-protein networks, and functional characterization of user-uploaded gene/measurement sets. Nucleic Acids Res. 2021;49((D1)):D605–D612. doi: 10.1093/nar/gkaa1074. [DOI] [PMC free article] [PubMed] [Google Scholar]
- 28.Telgmann R, Brand E, Nicaud V, Hagedorn C, Beining K, Schönfelder J, et al. SAH gene variants are associated with obesity-related hypertension in Caucasians: the PEGASE Study. J Hypertens. 2007;25((3)):557–564. doi: 10.1097/HJH.0b013e3280144779. [DOI] [PubMed] [Google Scholar]
- 29.Tripathi A, Vana PG, Chavan TS, Brueggemann LI, Byron KL, Tarasova NI, et al. Heteromerization of chemokine (C-X-C motif) receptor 4 with α1A/B-adrenergic receptors controls α1-adrenergic receptor function. Proc Natl Acad Sci U S A. 2015;112((13)):E1659–68. doi: 10.1073/pnas.1417564112. [DOI] [PMC free article] [PubMed] [Google Scholar]
- 30.Wang NP, Erskine J, Zhang WW, Zheng RH, Zhang LH, Duron G, et al. Recruitment of macrophages from the spleen contributes to myocardial fibrosis and hypertension induced by angiotensin II. J Renin Angiotensin Aldosterone Syst. 2017;18((2)):1470320317706653. doi: 10.1177/1470320317706653. [DOI] [PMC free article] [PubMed] [Google Scholar]
- 31.Wang Y, Dembowsky K, Chevalier E, Stüve P, Korf-Klingebiel M, Lochner M, et al. C-X-C motif chemokine receptor 4 blockade promotes tissue repair after myocardial infarction by enhancing regulatory T cell mobilization and immune-regulatory function. Circulation. 2019;139((15)):1798–1812. doi: 10.1161/CIRCULATIONAHA.118.036053. [DOI] [PMC free article] [PubMed] [Google Scholar]
- 32.Wenzel UO, Ehmke H, Bode M. Immune mechanisms in arterial hypertension. Recent advances. Cell Tissue Res. 2021;385((2)):393–404. doi: 10.1007/s00441-020-03409-0. [DOI] [PMC free article] [PubMed] [Google Scholar]
- 33.Yang C, Han X, Jiang X, Lei X, Bai L, Xu F. Relation between C-X-C motif chemokine receptor 4 levels and the presence and extent of angiographic coronary collaterals in patients with chronic total coronary occlusion. Am J Cardiol. 2016;118((8)):1136–1143. doi: 10.1016/j.amjcard.2016.07.020. [DOI] [PubMed] [Google Scholar]
- 34.Yang R, Yao L, Du C, Wu Y. Identification of key pathways and core genes involved in atherosclerotic plaque progression. Ann Transl Med. 2021;9((3)):267. doi: 10.21037/atm-21-193. [DOI] [PMC free article] [PubMed] [Google Scholar]
- 35.Yu XJ, Zhang DM, Jia LL, Qi J, Song XA, Tan H, et al. Inhibition of NF-κB activity in the hypothalamic paraventricular nucleus attenuates hypertension and cardiac hypertrophy by modulating cytokines and attenuating oxidative stress. Toxicol Appl Pharmacol. 2015;284((3)):315–322. doi: 10.1016/j.taap.2015.02.023. [DOI] [PubMed] [Google Scholar]
- 36.Zhang X, Liu F, Bai P, Dong N, Chu C. Identification of key genes and pathways contributing to artery tertiary lymphoid organ development in advanced mouse atherosclerosis. Mol Med Rep. 2019;19((4)):3071–3086. doi: 10.3892/mmr.2019.9961. [DOI] [PMC free article] [PubMed] [Google Scholar]
- 37.Zhao E, Xie H, Zhang Y. Identification of differentially expressed genes associated with idiopathic pulmonary arterial hypertension by integrated bioinformatics approaches. J Comput Biol. 2021;28((1)):79–88. doi: 10.1089/cmb.2019.0433. [DOI] [PubMed] [Google Scholar]
- 38.Zhou X, Hansson GK. Detection of B cells and proinflammatory cytokines in atherosclerotic plaques of hypercholesterolaemic apolipoprotein E knockout mice. Scand J Immunol. 1999;50((1)):25–30. doi: 10.1046/j.1365-3083.1999.00559.x. [DOI] [PubMed] [Google Scholar]
- 39.Zhou Y, Zhou B, Pache L, Chang M, Khodabakhshi AH, Tanaseichuk O, et al. Metascape provides a biologist-oriented resource for the analysis of systems-level datasets. Nat Commun. 2019;10((1)):1523. doi: 10.1038/s41467-019-09234-6. [DOI] [PMC free article] [PubMed] [Google Scholar]
Associated Data
This section collects any data citations, data availability statements, or supplementary materials included in this article.
Supplementary Materials
Supplementary data
Supplementary data
Data Availability Statement
All data generated or analyzed during this study are included in this article and its online supplementary material files. Further inquiries can be directed to the corresponding author.


