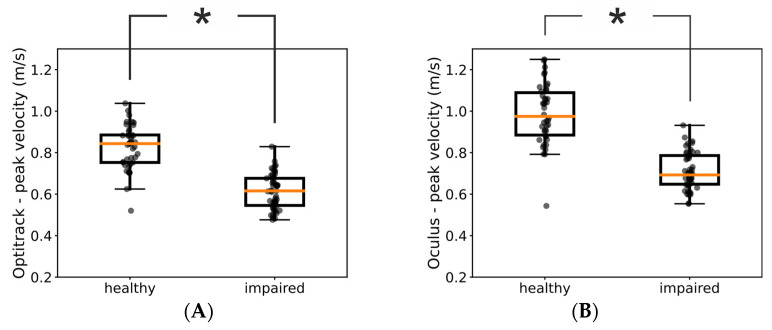
Figure 3.
Comparison of kinematic assessments using data from the Optitrack and Oculus systems. The two boxplots show the distributions of peak velocities of healthy and impaired hand obtained with the Optitrack (A) and Oculus (B) systems in one patient. In both panels, each dot represents a trial and the asterisk indicates a statistically significant difference (p < 0.05).

