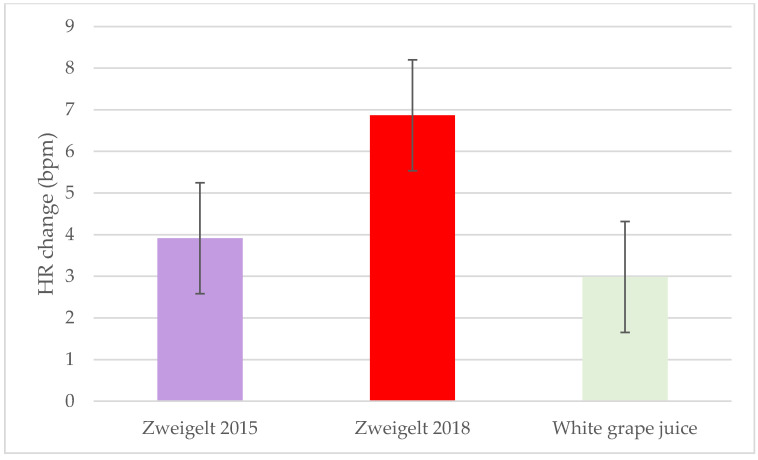
Figure 5.
Least-squares mean plot of overall change from baseline of heart rate. A linear mixed model was used to assess changes from baseline using time and intervention groups as the main effects and individual participants as the random effect. Data are the LSM ± SEM; HR, heart rate; bpm, beats per minute.

