Figure 7.
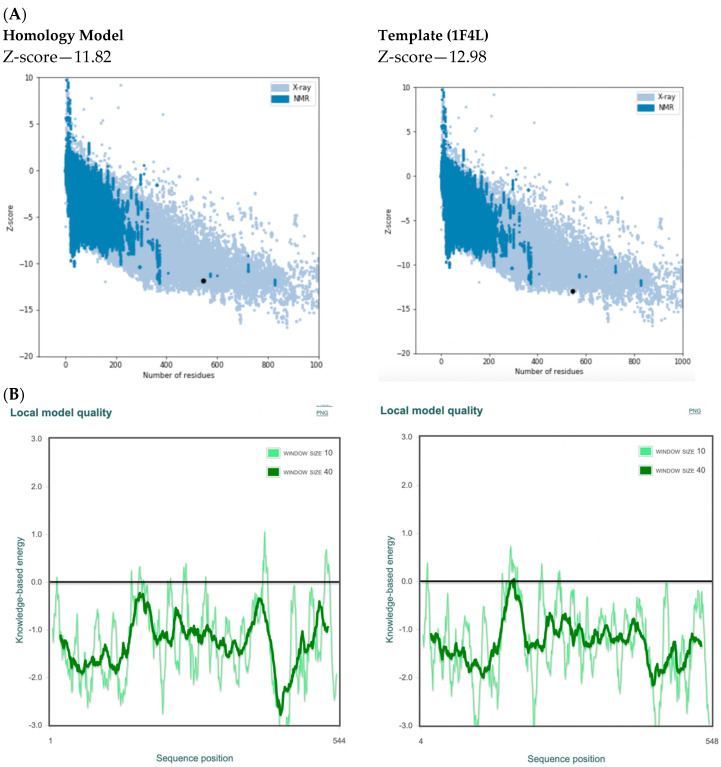
ProSA output showing: (A) overall model quality (z-score) of the P. mirabilis MetRS homology model and template E. coli MetRS (pdb 1F4L) in a plot that contains the z-scores of all experimentally determined protein chains in current PDB from different sources (X-ray, NMR) as distinguished by different colors and (B) local model quality plot.

