Table 3.
Ligand structures and protein–ligand (P/L) RMSD at 0 and 200 ns.
| Ligand | Structure | P/L RMSD (Å) 0 ns |
P/L RMSD (Å) 200 ns |
|---|---|---|---|
| Methionine |
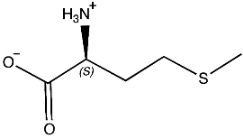
|
2.14/1.50 | 3.74/6.80 |
| MPH |
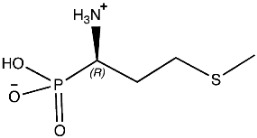
|
1.46/1.18 | 4.00/6.67 |
| MPJ |
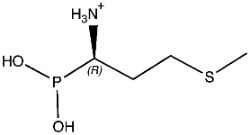
|
2.44/1.97 | 2.84/6.49 |
| 2FM |
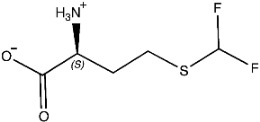
|
1.59/1.79 | 2.57/5.29 |
| MF3 |
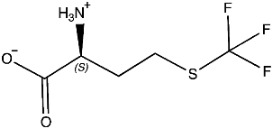
|
1.36/2.72 | 4.08/3.17 |
| MSP |

|
1.15/2.52 | 2.65/7.56 |
| Methionyl adenylate |

|
1.92/3.63 | 2.59/4.36 |
