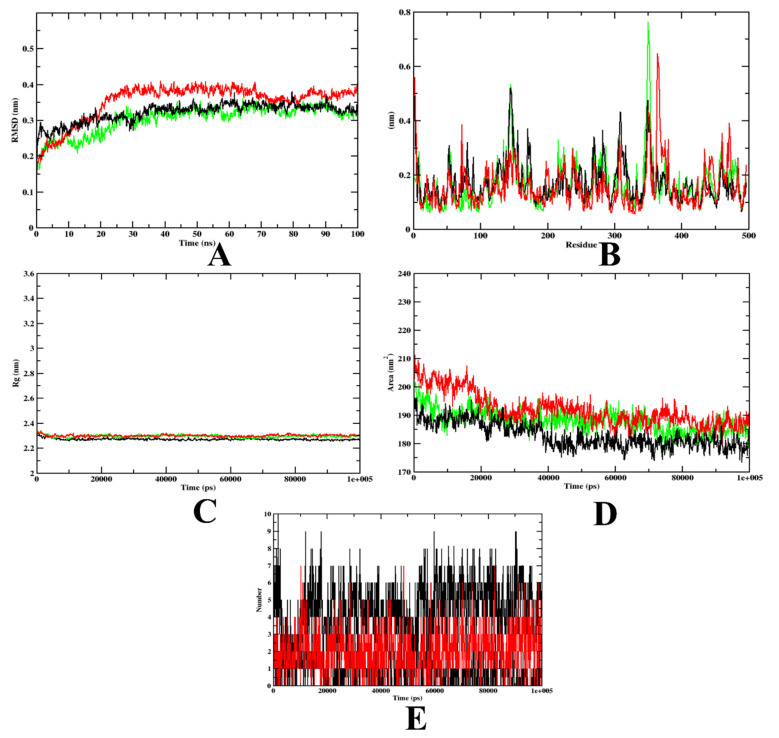
Figure 6.
A plot of the molecular dynamics simulation trajectories obtained after 100 ns for 7d and acarbose bound with the α-amylase protein. (A) RMSD; (B) RMSF; (C) Rg; (D) SASA; (E) Ligand hydrogen bonds; Green: α-amylase apoprotein; Black: α-amylase–7d complex; Red: α-amylase–acarbose complex (negative control).

