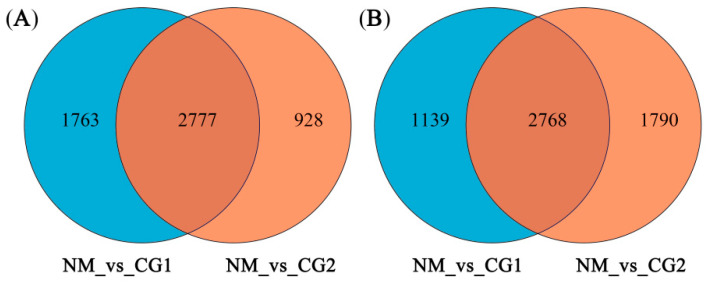
Figure 8.
Venn diagram depicting the number of shared and specific differentially expressed genes (DEGs) induced by CG1 inoculation (NM_vs_CG1) and with CG2 inoculation (NM_vs_CG1). Up-regulated DEGs (A) and down-regulated DEGs (B). |log2Fold change| ≥ 2 and FDR < 0.05 were used as the screening criteria of DEGs. NM_vs_CG1/2 indicates: NM is the control group and CG1/2 is the experimental group.

