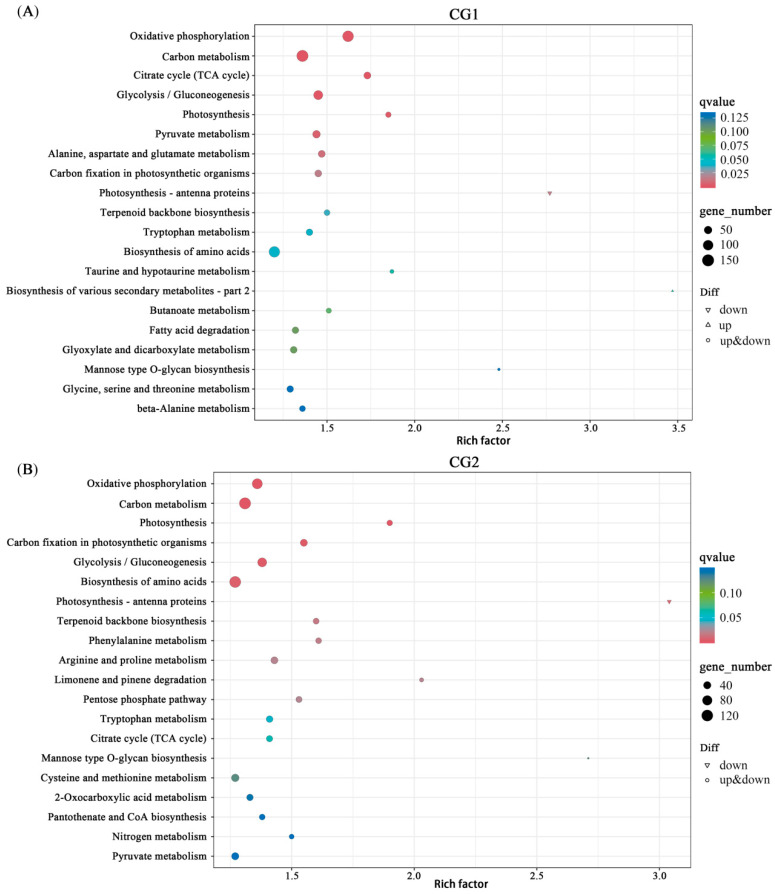
Figure 10.
KEGG enrichment of the DEGs in CG1 (A) and CG2 (B) treatments. Each symbol (circle and triangle) in the figure represents a KEGG pathway, the ordinate indicates the name of the pathway, and the abscissa is the enrichment factor. The size of the symbol represents the number of DEGs involved in the corresponding pathways.

