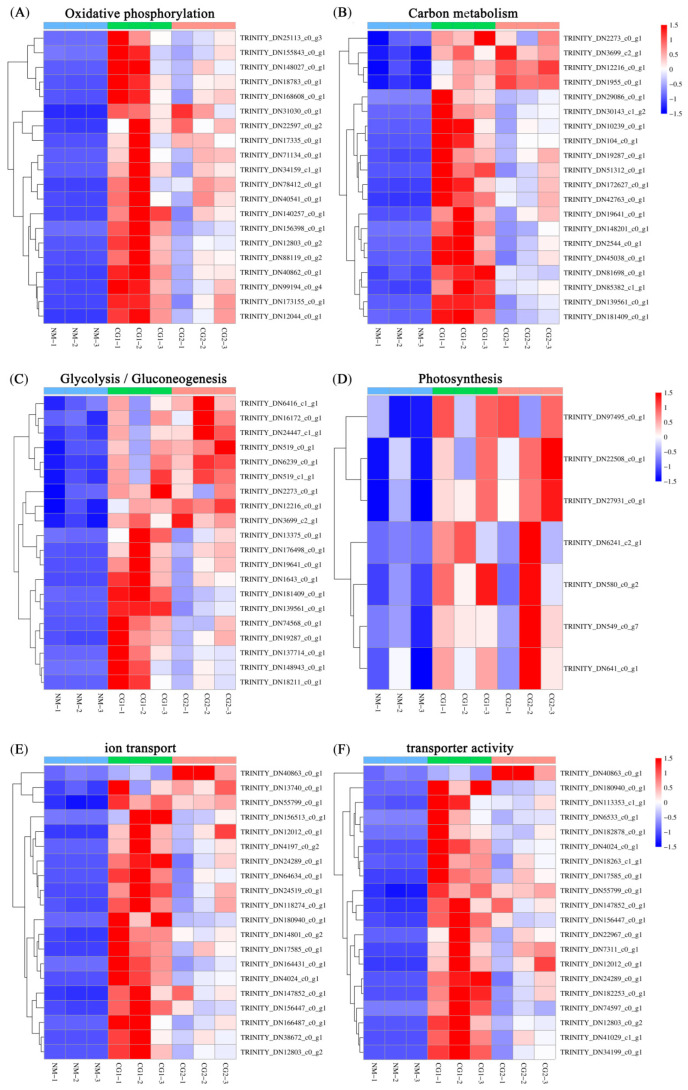
Figure 11.
The heatmap of part up-regulated DEGs in the different pathways in NM, CG1, and CG2 treatments. (A) oxidative phosphorylation pathway, (B) carbon metabolism pathway, (C) glycolysis/gluconeogenesis pathway, (D) photosynthesis pathway, (E) ion transport pathway, (F) transporter activity pathway. The Y- and X-axes represent the differentially expressed genes and different samples. The different colors of the heatmap, ranging from blue to white to red, represent scaled expression levels of genes with [log10(FPKM + 0.000001)] across different samples.

