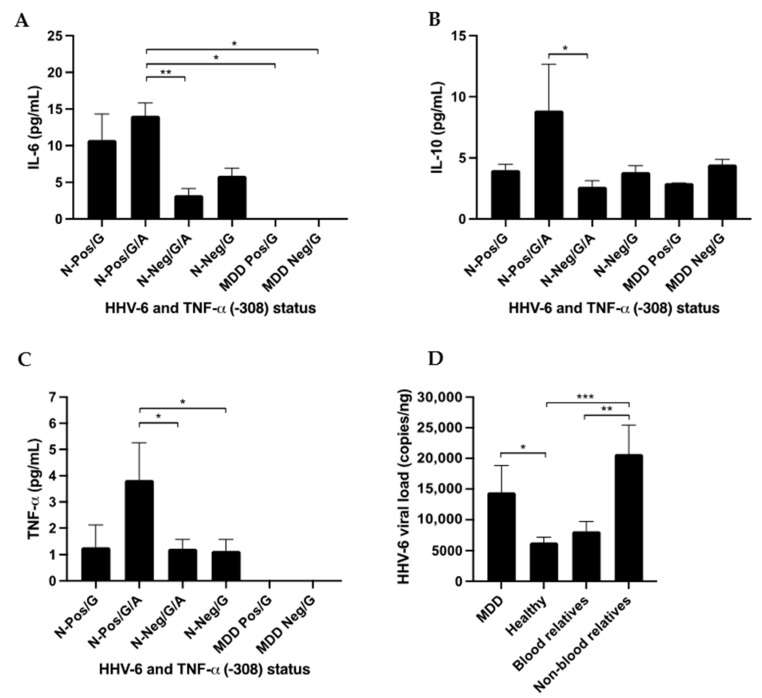
Figure 6.
The association of HHV-6 and TNF-α promotor status with cytokine expression measured using ELISA and HHV-6 viral load. N = normal healthy control. Healthy: positive/G, positive/G/A, negative/G/A, negative/G; and MDD patients being treated with drugs: positive/G, negative/G were available for ELISA analysis. (A) IL-6 cytokine level, (B) IL-10 cytokine level, (C) TNF-α cytokine level, and (D) HHV-6 viral load. * p-value < 0.05, ** p-value < 0.01 and *** p-value < 0.001.

