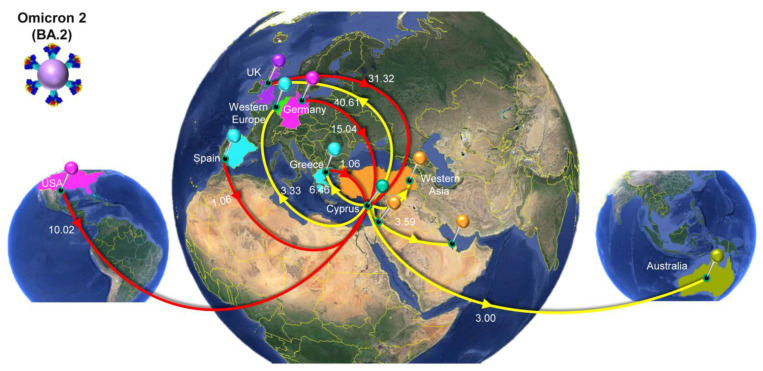
Figure 8.
Map of SARS-CoV-2 Omicron 2 (BA.2) transmission between Cyprus and other countries. The geographic origins of SARS-CoV-2 Omicron 2 (BA.2) imported into Cyprus are depicted with red lines; exports from Cyprus to other countries are depicted with yellow lines. Countries acting as “sources” or “sinks” for SARS-CoV-2 Omicron 2 (BA.2) transmission are highlighted and labeled, and the estimated average number of migration events is indicated. In Western Europe, the highlighted countries are Luxembourg, Belgium, and the Netherlands. In Western Asia, the highlighted countries are Bahrain, Turkey, and Israel. To enhance the clarity of the figure, only the locations with the five highest estimated total average numbers of importation or exportation events are displayed (Table 2). Map images courtesy of Google Earth Pro 7.3.2.5776 and 7.3.4.8642 (14 December 2015). Global view centered on North and South America (left), 5°49′53.21″ N 81°12′52.44″ W, Eye alt 9503.85 km. Europe (middle), 36°16′38.78″ N 36°07′29.71″ E, Eye alt 7949.12 km. South-Eastern Asia and Oceania (right), 1°14′19.88″ N 112°15′56.16″ E, Eye alt 11,201.60 km. US Dept. of State Geographer, DATA SIO, NOAA, U.S. Navy, NGA, and GEBCO. Image Landsat/Copernicus. 2018 and 2023 © Google. https://www.google.com/earth/versions/#earth-pro (accessed on 10 April 2019 and 16 July 2023).

