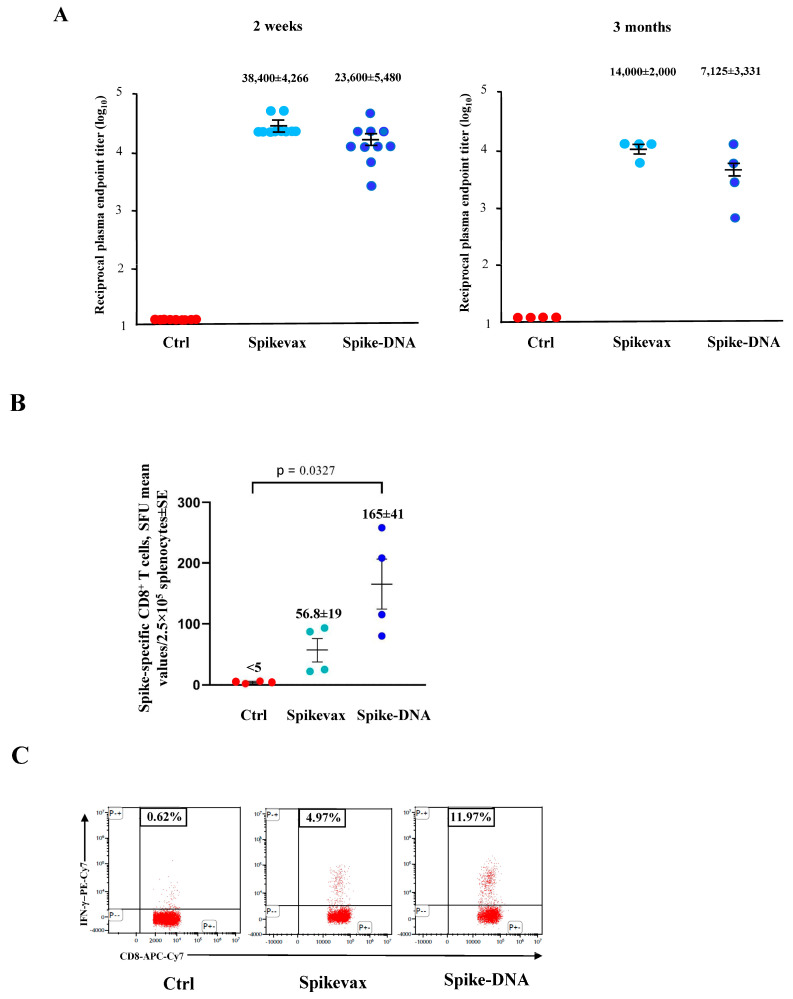
Figure 4.
Spike-specific immune responses in both Spikevax and DNA-spike vaccinated mice. (A) Detection of anti-S1 antibodies in plasma of K18-hACE2 mice two weeks (on the left) and three months (on the right) after injection with either Spikevax or Spike-DNA vaccines. As a control, mice were injected with isotonic buffer (Ctrl). Measures were conducted in plasma from 10 (two weeks after boosting) and 4 (three months after boosting) mice per group. The log10 of reciprocal endpoint titers is shown, together with intragroup means ± SE. (B) Detection of SARS-CoV-2-spike-specific CD8+ T-cells in splenocytes isolated from K18-hACE2 mice i.m. injected with either Spikevax vaccine, spike-expressing DNA vector, or buffer (Ctrl, 4 mice per group) three months after vaccination. A total of 2.5 × 10⁵ splenocytes were incubated overnight with 5 μg/mL of either unrelated or spike-specific peptide in IFN-γ ELISpot microwells. The numbers of SFUs/well calculated are shown as mean values of triplicates after subtraction of the mean SFUs counted in wells with splenocytes treated with the unspecific peptide (<10 spots for each cell culture tested). The intragroup mean values ±SE are reported. (C) Representative dot plots from ICS/flow cytometry analysis for the expression of IFN-γ in PBMCs from mice injected, as indicated. Cells were cultivated overnight with either a spike-specific or an unrelated peptide. Data shown were obtained with PBMCs pooled from two mice per condition, representative of two experiments. Quadrants were set on the basis of cell fluorescence of samples treated with the unrelated peptide.

