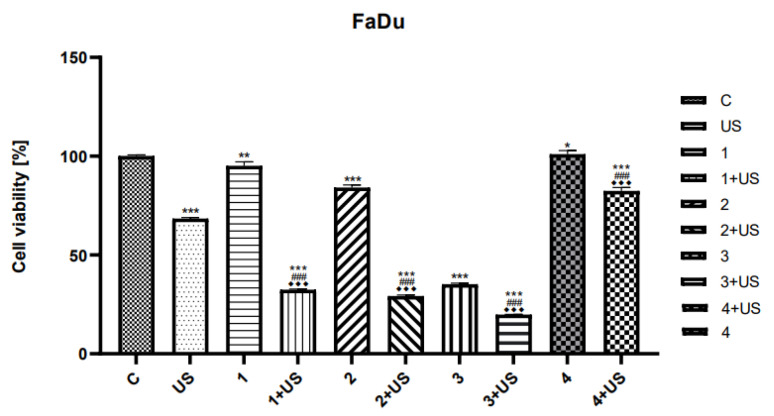
Figure 6.
The viability of FaDu cells treated with compounds tested (1–4) alone and the US combined with 1–4. Results of three independent replicates are presented as means ± SEMs compared to control (*), US (#), or compounds alone (♦). Note: *** p < 0.001, ** p < 0.01, and * p < 0.05, ### p < 0.001, ♦♦♦ p < 0.001.

