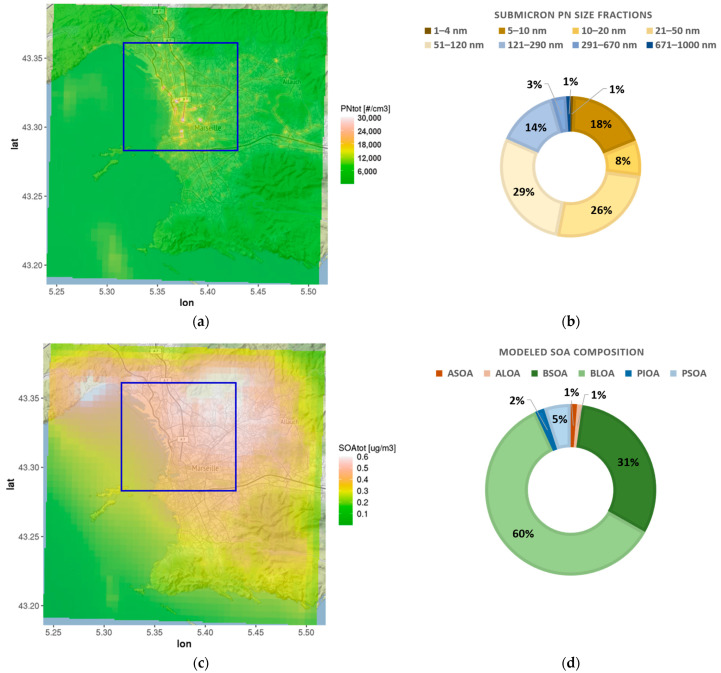
Figure 4.
Simulated monthly mean (July 2020) concentrations of PN and SOA for Marseille: (a) total PN; (b) average size fractions of submicron PN in the city port area; (c) total SOA; (d) average SOA composition in the port city area. The extent of city port area is indicated as blue frame in figure parts (a,c).

