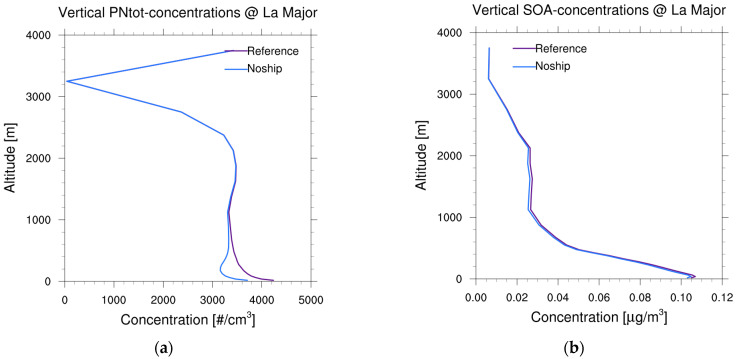
Figure A4.
Vertical profile of (a) total PN and (b) total SOA over port site La Major as monthly mean of July 2020. The difference between the vertical profile of the reference simulation (blue line) and the “noship” simulation (purple line) corresponds to the ship’s impact on the pollutant’s profile.

