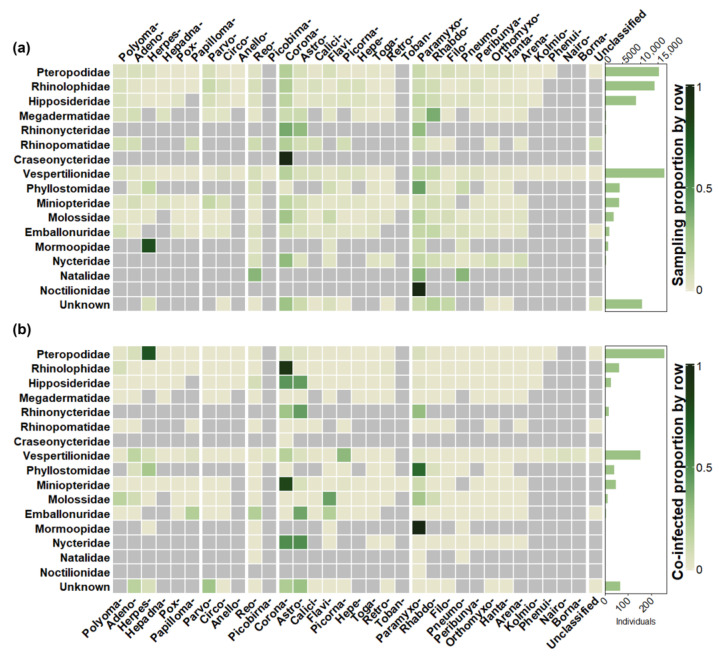
Figure 6.
Heat map displaying the screening effort and detection of each pairwise host and viral family combination recorded in the database. The bar chart on the right displays the number of individual bats tested or infected from each host family for each row. The heat map then displays the proportion of those individuals tested or co-infected with the viral family on each column. Values used to generate the plot are from Tables S5 and S6. (a) Screening effort. (b) Co-infections detected. Grey cells are combinations not tested for. Columns and rows are grouped by virus genome structure. The same viral families, in abbreviated form, are present in Figure 5.

