| 1 |
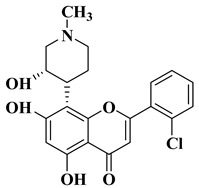 Flavopiridol Flavopiridol |
|
[44] |
| 2 |

|
R = OCH3
-
-
Cell lines of hematologic cancers RPMI8226 (99.70%), CCRFCEM (68.74%), HL60(TB) (64.01%), K562 (72.38%), MOLT4 (89.58%), SR (70.19%), growth inhibition determined at 10 µM dosage.
-
-
Non-small-cell lung cancer (NSCLC) A549 (56.48%), HOP62 (62.50%), HOP92 (75.26%), H226 (41.45%), H23 (51.21%), H460 (69.96%), H522 (65.28%), growth inhibition determined at 10 µM dosage.
-
-
Breast cancer cells MCF7 (65.73%), HS578T (90.80%), BT549 (73.02%), MDAMB468 (52.58%), growth inhibition determined at 10 µM dosage.
|
[30] |
R = OH
-
-
Ovarian cancer cell lines OVCAR3 (76.24%), OVCAR8 (76.91%), ADRRES (50.62%) at 10 µM dosage.
-
-
Breast cancer cells MCF7 (50.65%), HS578T (103.91%), BT549 (93.00%), MDAMB468 (40.13%), growth inhibition determined at 10 µM dosage.
|
| 3 |
|
-
-
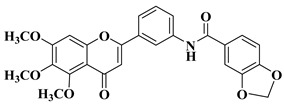
Cell lines of hematologic cancers RPMI8226 (153.74%), CCRFCEM (111.94%), HL60(TB) (65.43%), K562 (82.60%), MOLT4 (97.10%), SR (88.49%), growth inhibition determined at 10 µM dosage.
-
-
Non-small-cell lung cancer cell lines (NSCLC) HOP92 (106.11%), H322M (56.46%), H460 (72.81%), H522 (63.27%), growth inhibition determined at 10 µM dosage.
|
[30] |
| 4 |
|
-
-
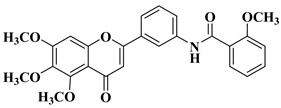
Cell lines of hematologic cancers RPMI8226 (93.25%), CCRFCEM (83.98%), HL60(TB) (42.34%), K562 (63.61%), MOLT4 (71.17%), growth inhibition determined at 10 µM dosage.
-
-
Non-small-cell lung cancer cell lines (NSCLC) A549 (51.79%), HOP92 (100.39%), H322M (56.40%), H522 (55.74%), growth inhibition determined at 10 µM dosage.
|
[30] |
| 5 |
|
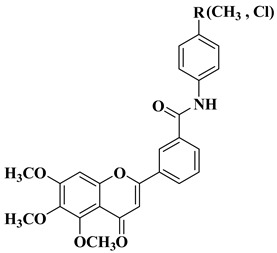
melanoma (160.26–107.81% SKMEL5), hematologic (111.12–92.74% leukemia HL60), renal (129.05% RXF393), colon (98.27–82.03% COLO205), lung (93.28% H522), brain (147.04–141.63% SF295 glioma), ovarian (76.54–51.79% IGROV1, OVCAR3, OVCAR8, ADREES, SKOV3), growth inhibition determined at 10 µM dosage.
|
[31] |
| 6 |
|
|
[32] |
| 7 |
|
|
[10] |
| 8 |
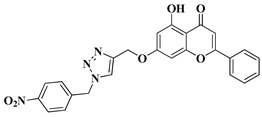
|
-
-
Non-small cell lung cancer cell lines: HOP-62 (GI50 = 3.76 µM), HOP-92 (GI50 = 4.43 µM), NCI-H226 (GI50 = 3.51 µM), NCI-H23 (GI50 = 7.70 µM), NCI-H522 (GI50 = 6.60 µM).
-
-
Colon cancer cell line: HCT-116 (GI50 = 5.91 µM).
-
-
Central nervous system cancer cell lines: SF-268 (GI50 = 4.32 µM), SF-539 (GI50 = 5.17 µM), SNB-19 (GI50 = 4.51 µM), SNB-75 (GI50 = 3.74 µM).
-
-
Melanoma: MALME-3M (GI50 = 5.06 µM), SK-MEL-2 (GI50 = 6.80 µM).
-
-
Ovarian cancer cell lines: OVCAR-8 (GI50 = 3.76 µM), NCI/ADR-RES (GI50 = 5.57 µM), SK-OV-3 (GI50 = 6.57 µM).
-
-
Renal cancer cell lines: 786-0 (GI50 = 9.26 µM), ACHN (GI50 = 6.23 µM), CAKI-1 (GI50 = 5.76 µM), RXF 393 (GI50 = 3.58 µM).
-
-
Breast cancer cell lines: HS 578T (GI50 = 6.26 µM), BT-549 (GI50 = 7.98 µM).
|
[33] |
| 9 |
|
-
-
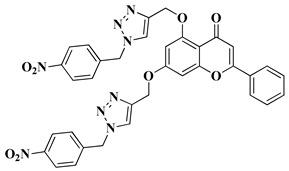
Non-small cell lung cancer cell lines: HOP-62 (GI50 = 2.33 µM), HOP-92 (GI50 = 1.89 µM), NCI-H226 (GI50 = 2.07 µM), NCI-H23 (GI50 = 3.70 µM), NCI-H522 (GI50 = 3.66 µM).
-
-
Colon cancer cell line: HCT-116 (GI50 = 3.52 µM).
CNS cancer: SF-268 (GI50 = 3.52 µM), SF-295 (GI50 = 2.32 µM), SF-539 (GI50 = 2.21 µM), SNB-19 (GI50 = 4.55 µM), SNB-75 (GI50 = 1.69 µM), U251 (GI50 = 2.80 µM).
-
-
Melanoma: MALME-3M (GI50 = 2.03 µM), SK-MEL-2 (GI50 = 4.49 µM).
-
-
Ovarian cancer cell line: IGROV1 (GI50 = 4.45 µM).
-
-
Renal cancer cell lines: 786-0 (GI50 = 1.96 µM), RXF 393 (GI50 = 1.78 µM), TK-10 (GI50 = 3.01 µM).
-
-
Breast cancer cell lines: MDA-MB-231/ATCC (GI50 = 2.34 µM), HS 578T (GI50 = 3.28 µM), MDA-MB-468 (GI50 = 1.97 µM).
|
[33] |
| 10 |
|
|
[34] |
| 11 |
|
|
[35] |
| 12 |
|
|
[35] |
| 13 |
|
|
[35] |
| 14 |
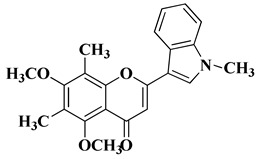
|
|
[35] |
| 15 |
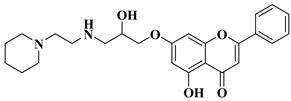
|
-
-
AR-negative castration-resistant prostate cancer cell line (CRPC) as topoisomerase II catalytic inhibitor (88.9% growth inhibition at 20 µM) and by intercalating and binding to the DNA minor groove (IC50 = 0.13 ± 0.007 µM).
-
-
Sensitizes AR-positive CRPC cells to enzalutamide and taxanes.
|
[45] |
| 16 |
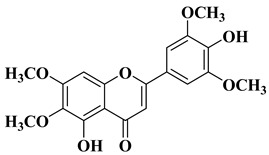
|
|
[46] |
| 17 |
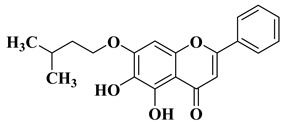
|
|
[11] |
| 18 |
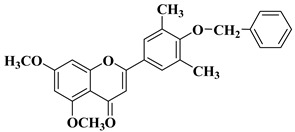
|
|
[47] |
| 19 |
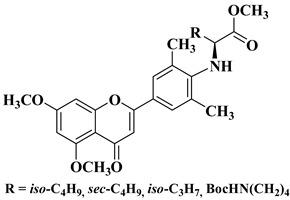
|
|
[47] |
| 20 |
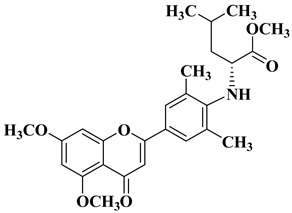
|
|
[47] |
| 21 |
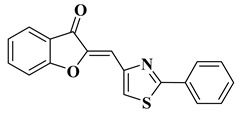
|
|
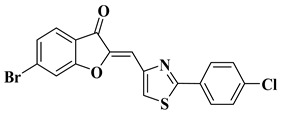
[43] |
| 22 |
|
|
[43] |
| 23 |
|
-
-
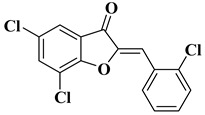
Human colorectal cancer cell line HCT 116 (IC50 = 36 µM).
-
-
Human chronic myelogenous leukemia cell line K562 (IC50 = 23 µM).
-
-
Hormone-dependent breast cancer cell line MCF-7 (IC50 = 23 µM).
|
[48] |
| 24 |
|
|
[48] |
| 25 |
|
-
-
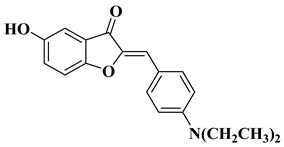
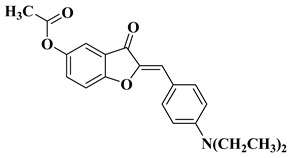
Inhibition of in vitro angiogenesis of HUVEC (human umbilical vein endothelial cells) proliferation, motility, and tube
formation (IC50 = 0.25 µM).
-
-
Anti-proliferative and anti-invasive
activities against A549 (non-small cell lung cancer cell line, IC50 = 1.25 µM), and MCF-7 (breast cancer cell line, IC50 = 1.81 µM).
|
[49] |
| 26 |
|
-
-
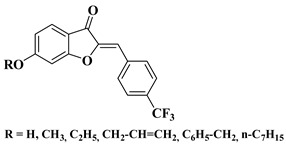
Inhibition of in vitro angiogenesis of HUVEC (human umbilical vein endothelial cells) proliferation, motility, and tube formation (IC50 = 0.23 µM).
-
-
Anti-proliferative and anti-invasive
activities against A549 (non-small cell lung cancer cell line, IC50 = 1.29 µM), and MCF-7 (breast cancer cell line, IC50 = 2.95 µM).
|
[49] |
| 27 |
|
|
[50] |
| 28 |
|
-
-
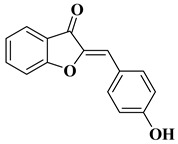
Human oral squamous carcinoma cell lines Ca9-22 (derived from gingival tissue, CC50 = 37 µM), HSC-2 (CC50 = 57 µM), and HSC-4 (derived from tongue, CC50 = 31 µM), with tumor-specificity in comparison to oral normal cells.
|
[51] |
| 29 |
|
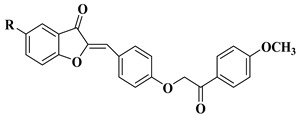
R = Cl: leukemia cell lines MOLT-4 (−17.79% mean growth percentage), and SR (−22.38% mean growth percentage).
R = H: renal cancer cell line UO-31 (−44.36% mean growth percentage).
The mean growth percentages were determined for five concentrations ranging from 10−4 to 10−8 M.
|
[52] |
| 30 |
|
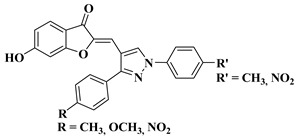
R′ = CH3 and R = CH3, OCH3, NO2 (IC50 = 25–28.3 µM).
R′ = NO2 and R = NO2 (IC50 = 25.1 µM). |
[53] |
| 31 |
|
|
[53] |
 Flavopiridol


