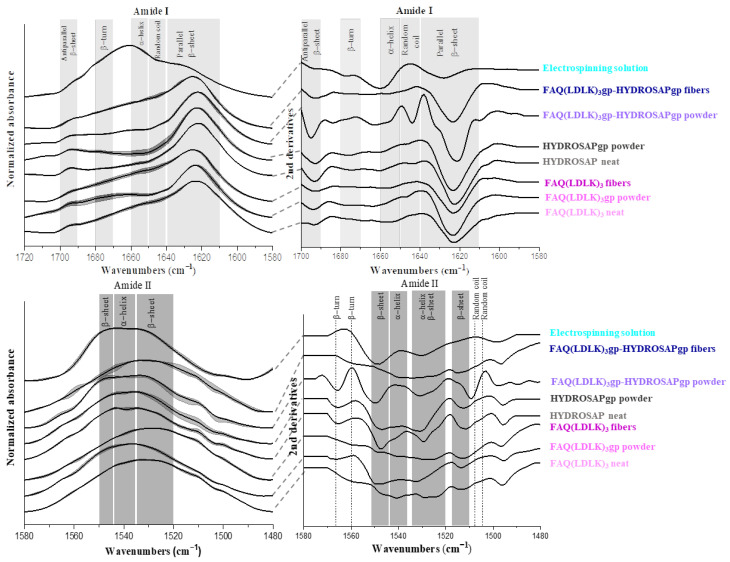
Figure 4.
FTIR spectra along with 2nd derivatives in amide I and II absorption region of entire samples: amide I (Up), Amide II (Down). Concerning amide I mode, the entire spectra, except the electrospinning solution, demonstrate the prominent absorption peaks in the region of β-sheet centered ~1630 cm−1. Electrospinning solution spectra show the main peak located in the region of α-helix. the spectral region corresponding to the amide II shows a broad peak in the region 1520–1545 cm−1 assigned to β-sheet and α-helix. Wavenumber ranges of the principal bands characteristic of peptide secondary structure [45,46].

