Figure 6.
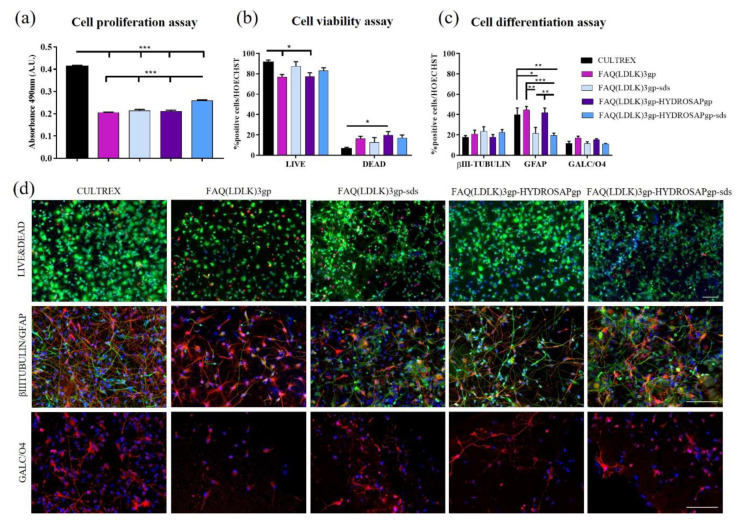
Proliferation, viability, and differentiation assays of hNSCs seeded on 2D scaffolds of FAQ(LDLK)3gp, FAQ(LDLK)3gp-sds, FAQ(LDLK)3gp-HYDROSAPgp and FAQ(LDLK)3gp-HYDROSAPgp-sds after 7 days in vitro. (a) Colorimetric MTS assay for cell proliferation assessment. (b) LIVE/DEAD Cell Viability/Cytotoxicity test to determine cell viability. (c) Immunostainings for βIII-Tubulin (neurons in green), GFAP (astrocytes in red), and GALC/O4 (oligodendrocytes in red) markers. (d) Representative fluorescence images for cell viability assay (top), neural and astroglial differentiation (middle), and oligodendroglial differentiation (bottom). Live cells are labeled in green, and dead cells in red. Cell nuclei were stained with HOECHST (in blue). Data are represented as mean ± SEM. Statistical analysis shows significant differences between conditions (* p < 0.05; ** p ≤ 0.01; *** p < 0.001). All measures were performed in triplicate. Scale bar, 100 µm.

