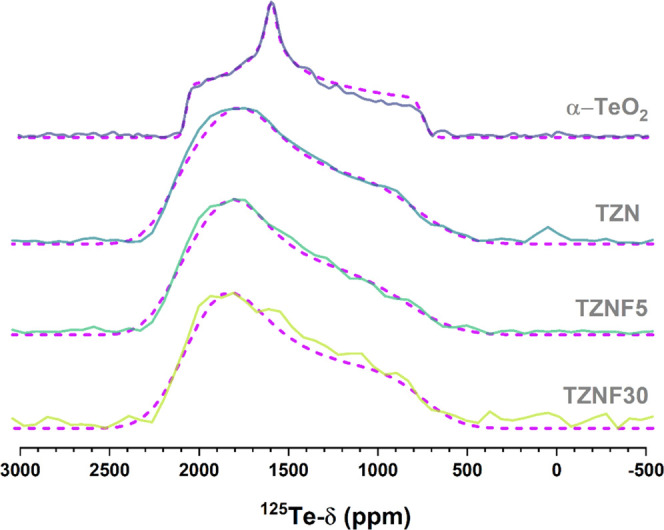
Figure 7.

WURST-CPMG 125Te NMR spectra for glass samples TZN, TZNF5, and TZNF30 (black solid curves). The plot shows Fourier-transformed spectra from the sum of the individual echoes in the CPMG FID. Red dashed curves are simulations considering distributions of static CSA powder patterns. 125Te Chemical shifts are referenced to Te(CH3)2.
