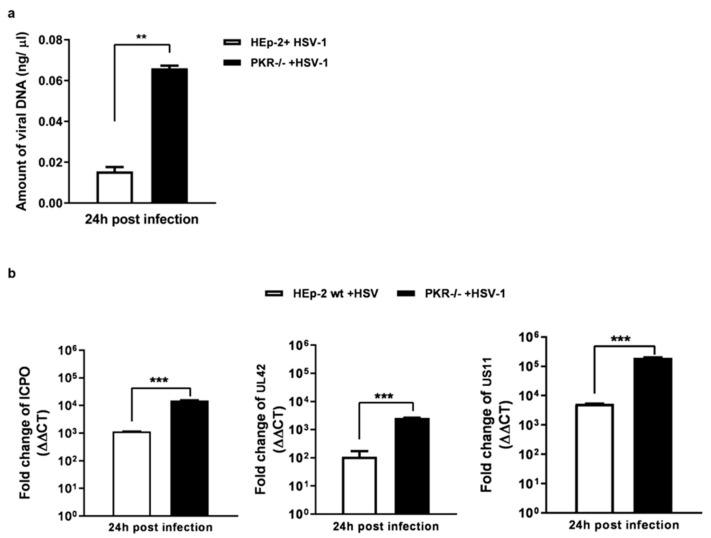
Figure 2.
Analysis of viral DNA and representative viral transcripts in PKR−/− compared to HEp-2 cell lines. PKR−/− and parental cell lines were infected with HSV-1 at MOI 10 and collected 24 h post-infection. (a) The absolute quantification of Real-time PCR was used to detect the amount of viral DNA in both cell lines by using a specific TaqMan probe. Viral load was derived from the threshold cycle (CT) using the standard curve generated in parallel, and the result is expressed as a concentration in ng of DNA/μL. (b) Expression of viral transcripts cascades in HEp-2 and PKR−/− cell lines. The mRNA was purified with Trizol according to the manufacturer’s instructions. The measure of changes in the expression level of ICPO, UL42, and US11 genes was analyzed by calculating the value of 2−ΔΔCt. The assay was performed as a means of triplicate ± SD and expressed as fold change over the housekeeping genes. *** < p < 0.0001 and ** <0.01.

