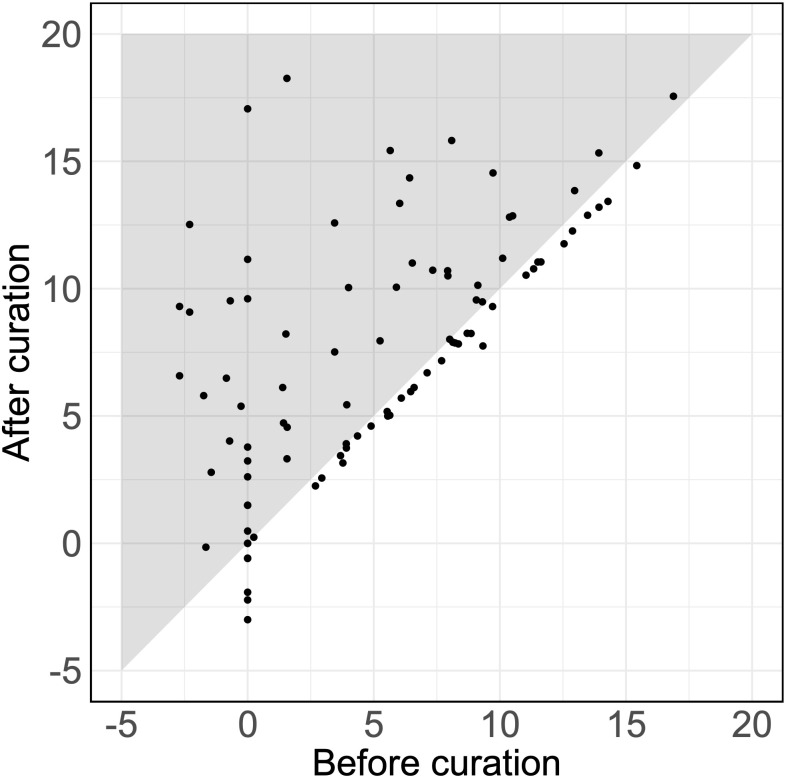
Figure 1.
Likelihood ratios for verified diseases using HPO terms. The LRs for the SAIDs of 92 patients using the original and the curated HPO set. Each dot represents the LR of the verified SAID of a patient. The x-axis and y-axis describe the log10(LR)s calculated using the set of HPO terms before curation and after curation, respectively. Dots that fall within the gray zone indicate SAIDs with an improved LR. LRs can be interpreted as how many times more (or less) likely it is that patients have the disease based on the documented HPO terms as compared to patients without the disease. Negative LRs thus indicate that these patients are less likely to have the disease. Using the curated HPO set, results showed an increased log10(LR) (p = 1.7 × 10⁻⁷) with an average increase of 2.61 [95% CI (1.71, 3.50)].

