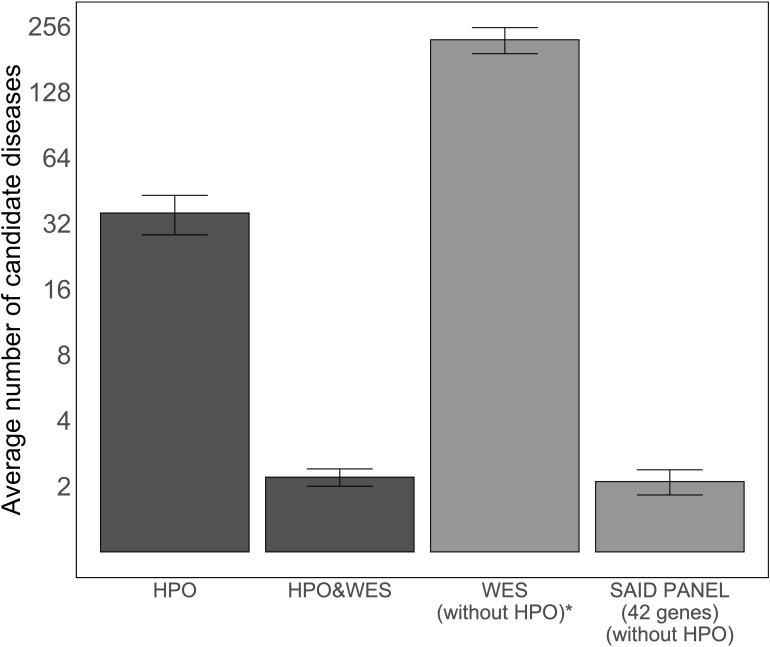
Figure 3.
Average number of candidate diseases using LIRICAL with the curated set of HPO terms and MOLGENIS VIP. The first two bars show the average numbers of candidate diseases detected using LIRICAL with HPO without WES data and with WES data as input, 35.7 [95% CI (28.4, 43.0)] and 2.2 [95% CI (2.0, 2.4)], respectively. The total number of candidate diseases and the SAID gene panel-filtered number of candidate diseases by MOLGENIS VIP were extracted by grouping the detected variants by gene (all studied SAIDs are monogenic), and these results are represented by the last two bars, with values of 222 [95% CI (191.7, 8,252.3)] and 2.1 [95% CI (1.8, 2.4)], respectively. A log2-transformation is applied on the y-axis to compare the height of the different bars. *The number of candidate diseases is very high and is therefore not used in a diagnostic setting. This analysis setting was to demonstrate that interpreting WES data without clinical direction results in a large number of variants.

