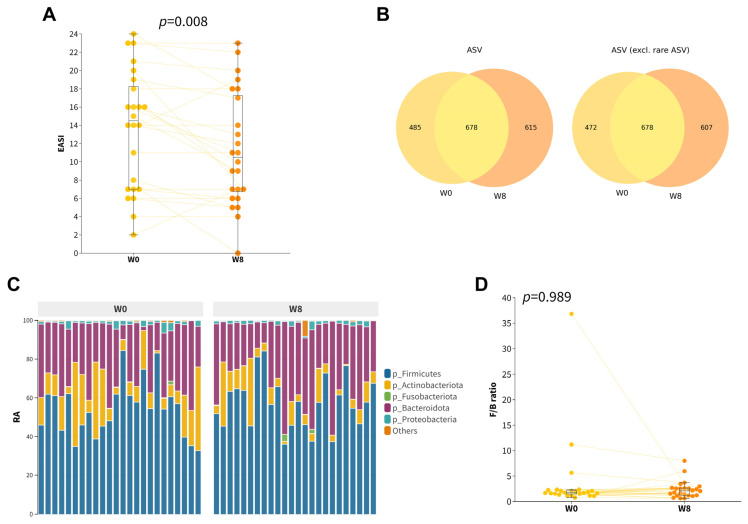
Figure 1.
Gut composition profiles of childhood AD participants at baseline and at week 8. (A) Boxplot of the EASI scores of the participants. (B) Venn diagram of all ASVs (left) and with rare ASVs excluded (right) at baseline and week 8. Rare ASVs were defined as ASVs that occurred in only one of the samples. (C) Relative abundance of top five main phyla. (D) Boxplot of Firmicutes/Bacteroidetes (F/B) ratio.

