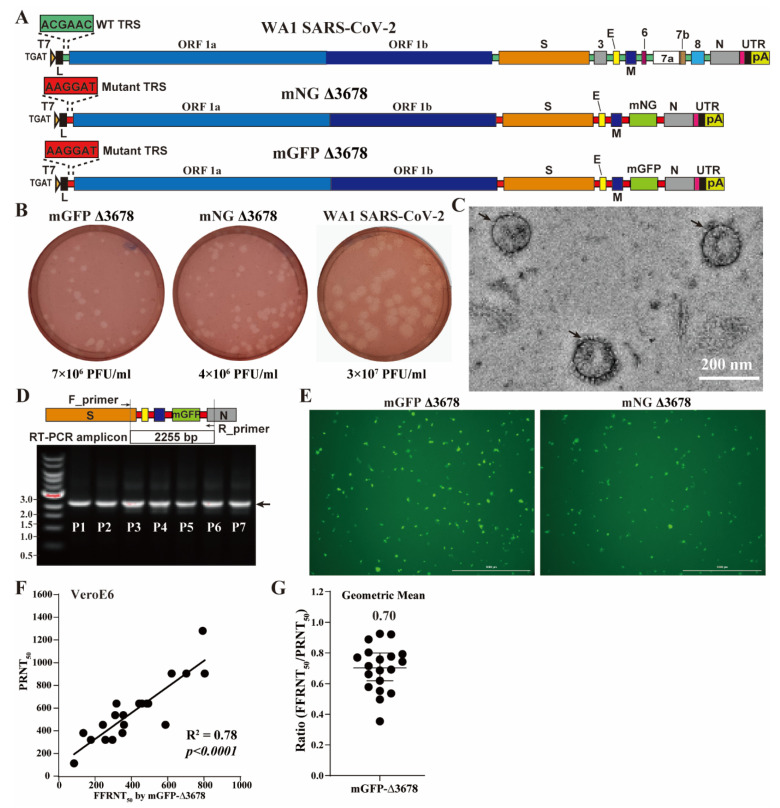
Figure 1.
mGFP Δ3678 for neutralization assay. (A) Diagram of the construction of mGFP Δ3678. The wild-type and mutated TRSs are colored green and red, respectively. mNG, mNeonGreen; mGFP, sequence-optimized green fluorescence protein. (B) Plaque morphologies on VeroE6-TMPRSS2 cells. Numeric values indicate viral titers of P1 stock. (C) Representative negative-stained electron microscopy micrographs of mGFP Δ3678. Scale bar, 200 nanometers; arrows, virions. (D) Gel analysis. A replicon between F_primer and R_primer was amplified with RT-PCR from the P1-P7 passaged mGFP Δ3678 and analyzed on a 0.6% native agarose gel. DNA ladders are indicated. The arrow indicates the fragment containing the mGFP sequence. (E) Fluorescent focus on VeroE6 cells after 20 h of infection with mGFP Δ3678 or mNG Δ3678. (F) Correlation of mGFP Δ3678 FFRNT with PRNT. PRNT50 was obtained with plaque assay using strain USA-WA1/2020 at BSL-3. The coefficient and p-value (two-tailed) calculated from a linear regression model are shown. (G) Ratios of mGFP Δ3678 FFRNT50 to PRNT50. The geometric mean is shown. The error bar indicates the 95% confidence interval of the geometric mean. The FFRNTs using mGFP Δ3678 and mNG Δ3678 [16] were performed in parallel by using the same set of serum samples.

