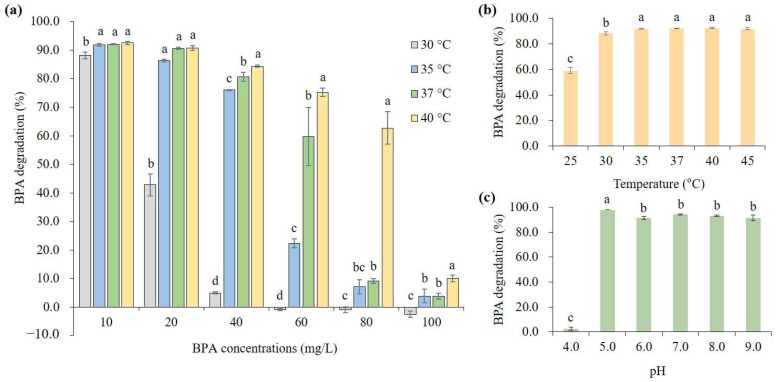
Figure 2.
Effects of culture conditions [(a) BPA concentration; (b) temperature; (c) pH] on BPA degradation by B. subtilis P74. The data represent the mean ± standard deviation from three independent experiments, and the values with different letters on the bar indicate significant differences (p < 0.05).

