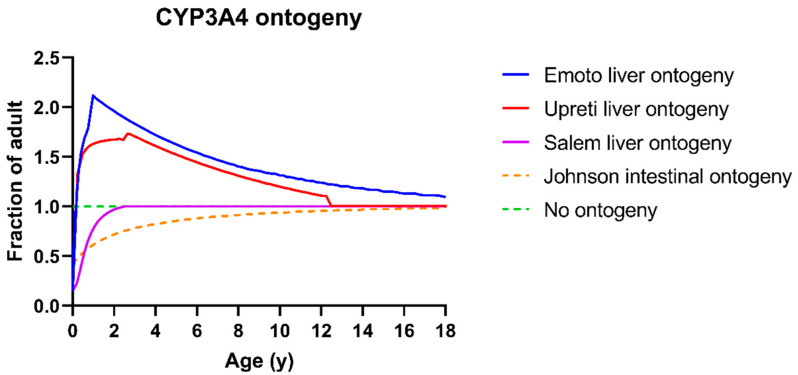
Figure 3.
Ontogeny profiles of CYP3A4 in both the intestine and the liver visualized as the fraction of adult expression as a function of age. Blue = liver CYP3A4 ontogeny profile as published by Emoto et al., red = Simcyp Upreti liver CYP3A4 ontogeny profile, dotted green = no ontogeny, purple = Simcyp Salem liver CYP3A4 ontogeny profile, dotted orange = SimCYP Johnson intestinal CYP3A4 ontogeny profile.

