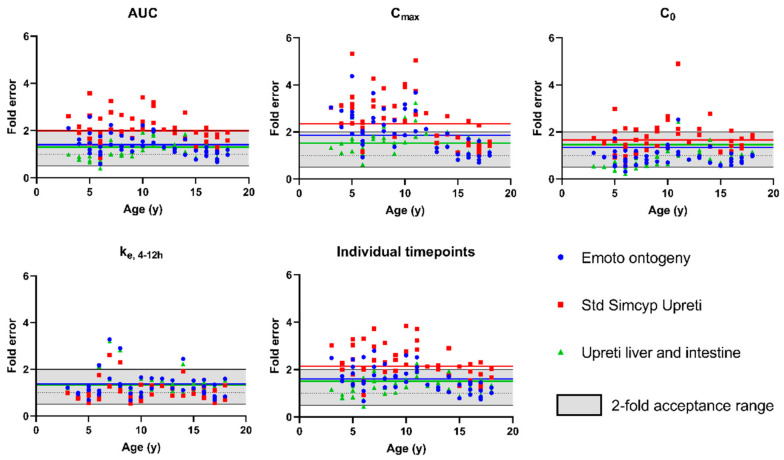
Figure 9.
Fold error of different paediatric PBPK models for tacrolimus on simulated PK parameters as a function of age. Grey coloured area indicates the 2-fold acceptance criteria. Blue dots = simulations using the Emoto ontogeny, Red squares = simulations using the Upreti ontogeny, Green triangle = simulations using the Upreti liver + intestine ontogeny. Full line indicates the respective AAFE for each PK parameter and model. All fold errors are on concentrations at steady state.

