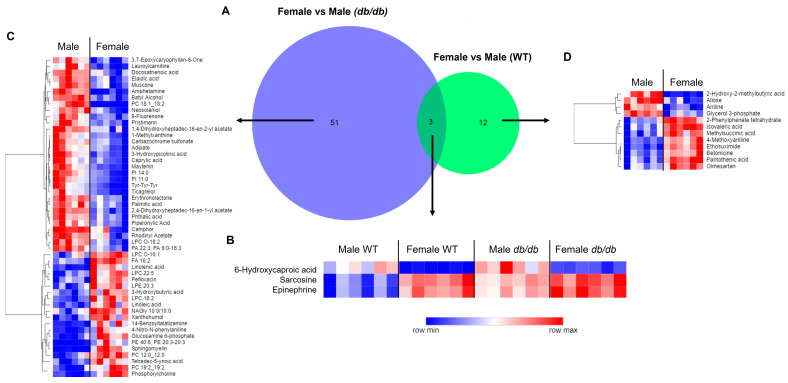
Figure 7.
Comparison of brain metabolic sex differences in T2DM and control mice. (A) Venn diagram comparison of metabolites significantly different by sex in T2DM db/db compared to control WT mice. Heatmaps of metabolites exhibiting sex differences common to T2DM db/db and control WT mice (B); in db/db mice, but not in WT mice (C); and in WT mice, but not in db/db mice (D). In heatmaps, relative levels of metabolites are indicated by a color scale; darker shades of blue indicate lower levels of a metabolite, while darker shades of red indicate higher levels of a metabolite.

