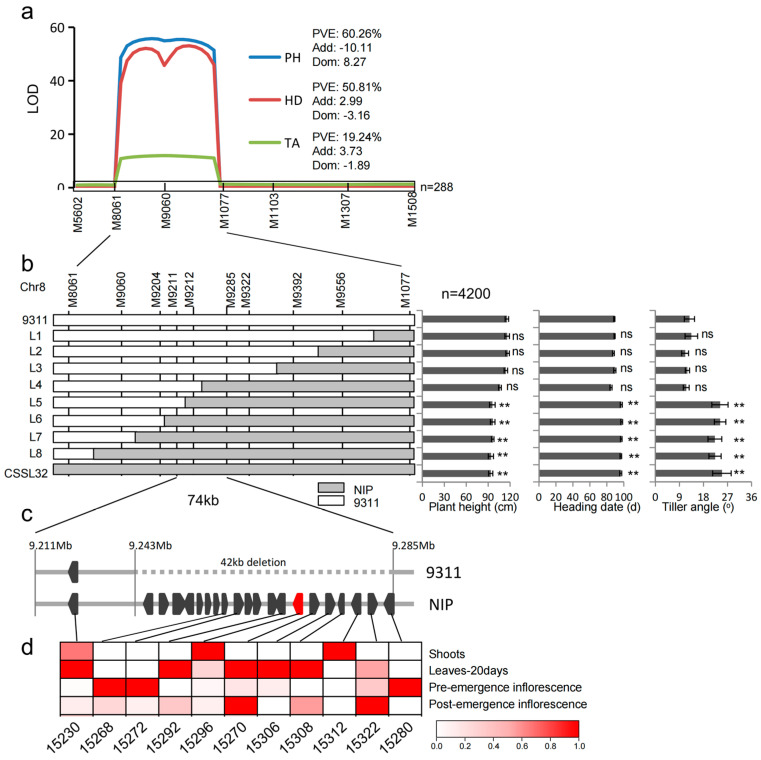
Figure 3.
Fine-mapping of qPH8.2. (a) Primary mapping of qPH8.2 in a CSSL-derived F2 population (n = 288) for plant height (PH), heading date (HD), and tiller angle (TA). (b) Fine-mapping of qPH8.2 to a 74 kb interval flanked by the markers M9211 and M9285 using a large population (n = 4200). The overlapped recombinant lines are provided with phenotypes by progeny testing. Values are given as mean ± SD (n = 8). ** denotes significant differences with 9311 at p < 0.01 by t-test. (c) The insertion region contains some promising genes. (d) The expression profile of some candidate genes from the database (http://rice.uga.edu/, accessed on 5 April 2023).

