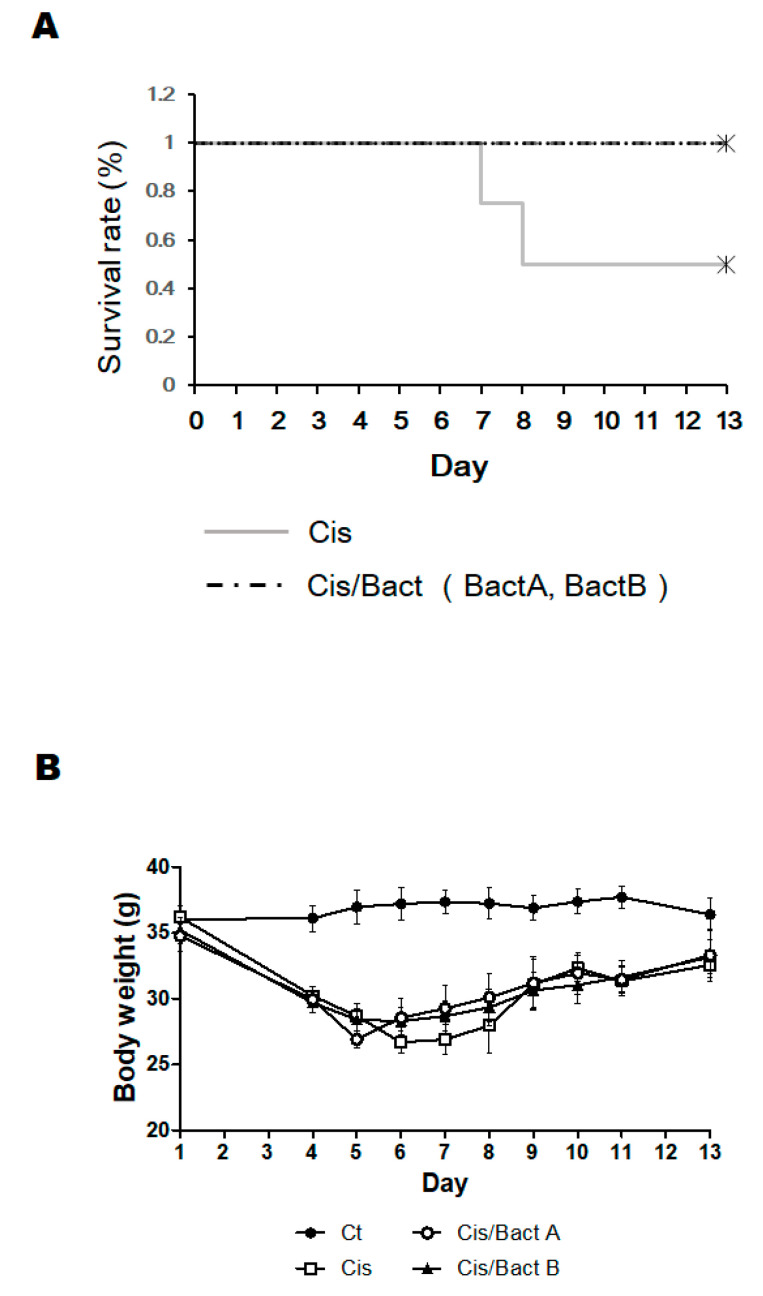
Figure 1.
The effects of Bacteria on prolonging mice lives. (A) Survival data of mice for 13 days using the Kaplan–Meier method. The gray line shows the Cis group, and the black dotted line shows Cis/Bact A and Cis/Bact B. Both the Cis group mice and Cis/Bact group mice received 11 mg/kg B.W. of cisplatin intraperitoneally. (B) Body weights were measured almost every day during the experiment. Ct group (black circle), Cis group (white square), Cis/Bact A group (white circle), and Cis/Bact B group (black triangle). Values are expressed as the mean ± S.E. n = 3–8/group.

