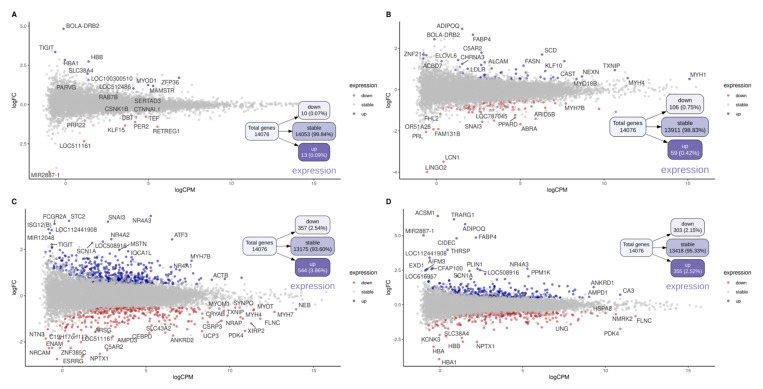
Figure 2.
MD plot of different contrasts between the early weaning (EW), conventional weaning (CW), time 1 (T1), and time 2 (T2) groups. MDplot containing general expression normalised (logCPM) (x-axis), Fold Change (logCPM) (y-axis) and significative up- and down regulated differentially expressed genes(blue or red dots, respectivelly). The total number and percentage of genes and DEGs prospected are represented into boxes in treeplot for each contrasts: early weaning (EW) vs. conventional weaning (CW) at time 1 (T1) (A) and time 2 (T2) (B), and T1 vs. T2 within EW (C), and CW (D).

