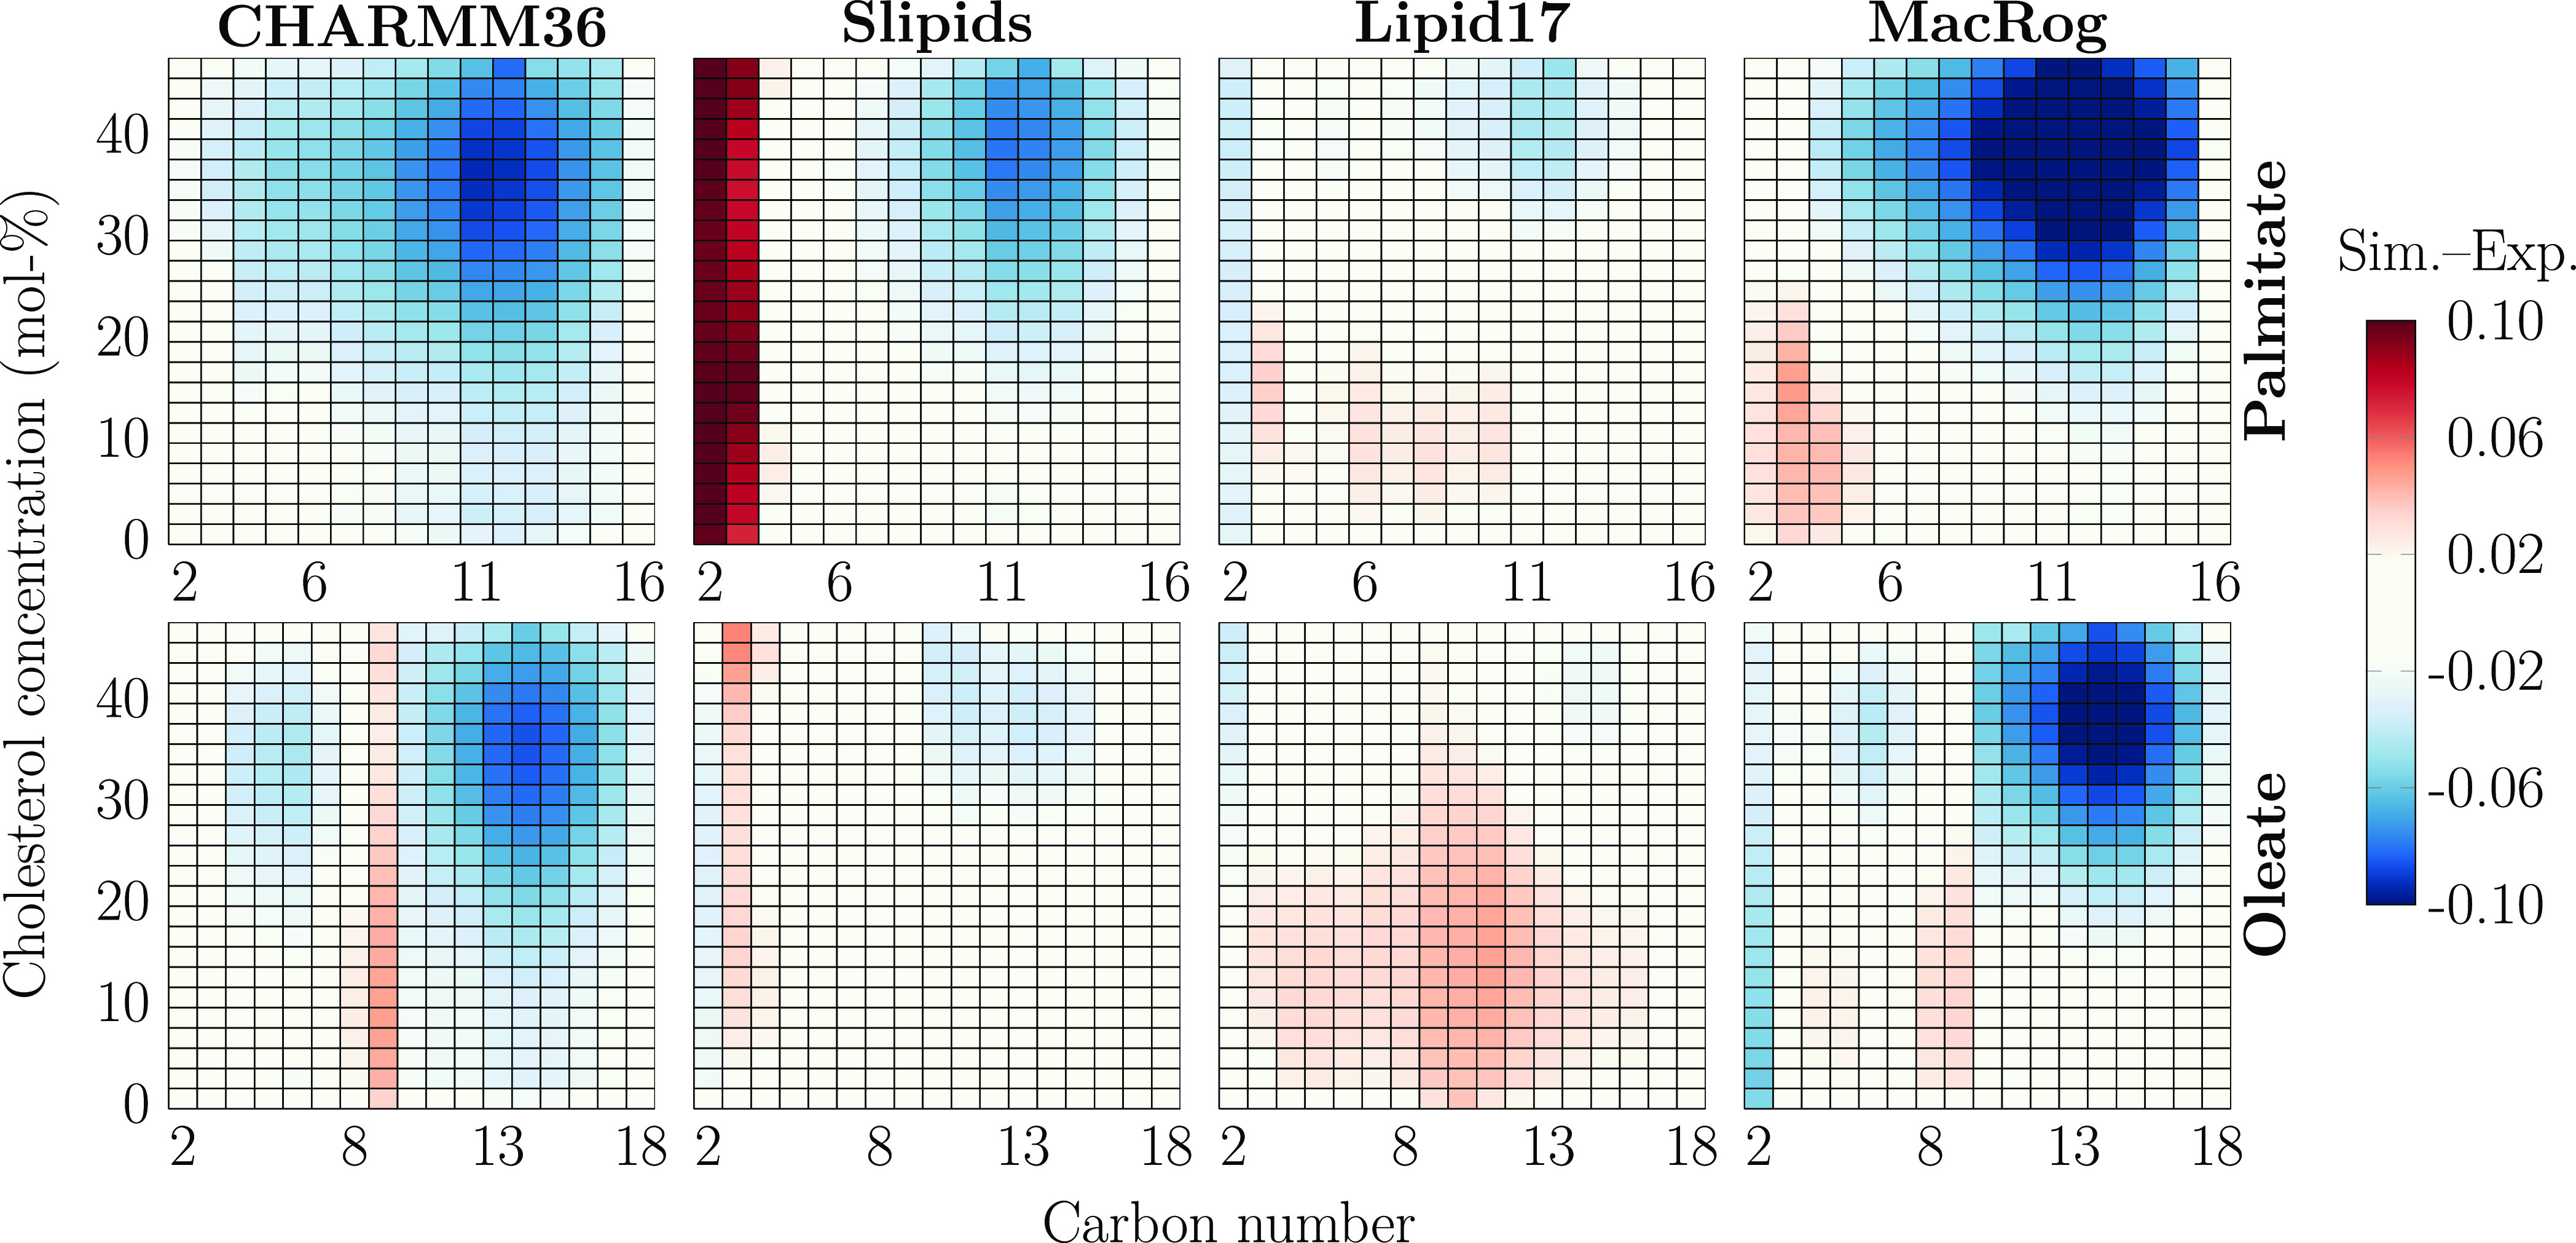
Figure 1.

POPC acyl chain order parameter deviation from experiments. Data are shown for palmitate (top row) and oleate (bottom row) and for the four force fields (columns). Negative values indicate that the order is too high (SCH values are too negative) in the simulations. The values that are within the estimated experimental error range of ±0.0239 are colored white. Statistical error in simulations is not considered here because it is approximately an order of magnitude smaller than the experimental error. Order parameters of hydrogens attached to the same carbon were averaged, except for the C2 carbon of the oleate chain (whose order parameters were forked), for which differences for both the larger and smaller values were calculated, and the average of these differences is shown in the C2 column.
