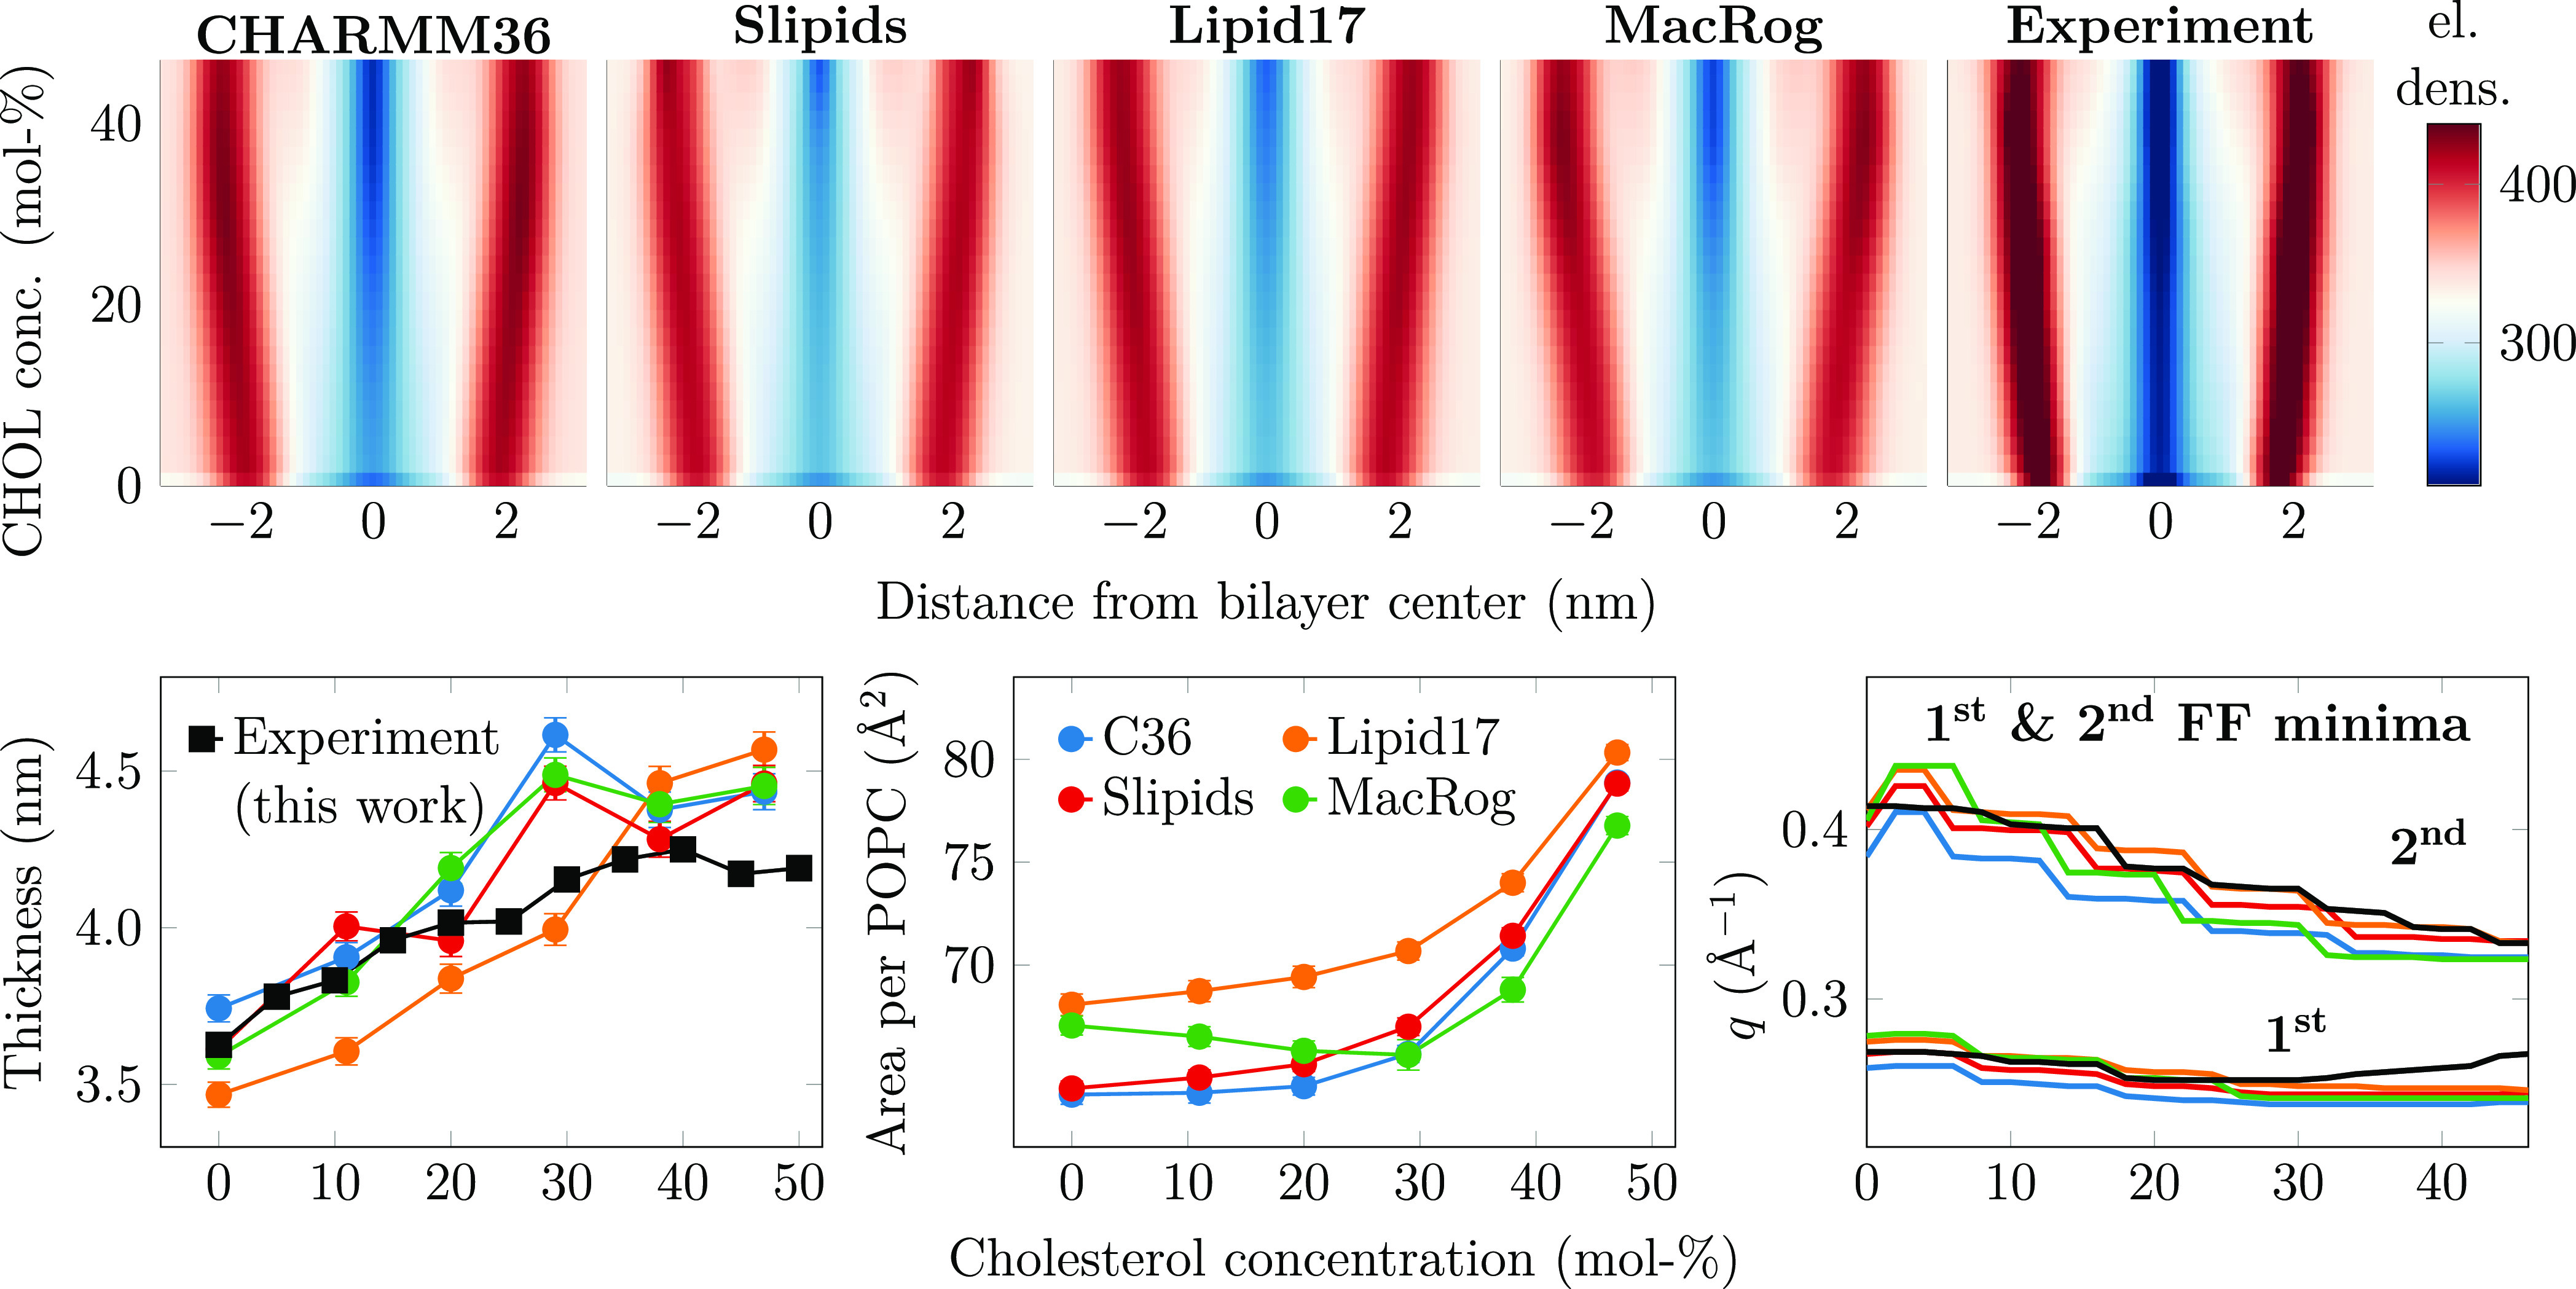
Figure 2.

Electron density profiles, thickness, and area per phospholipid as a function of CHOL concentration. Top: electron density maps were created for the simulations using four different force fields and for the experiment (from the SDP model). The color bar is common for all maps. The original electron density profiles are shown in Figure S4. The effect of system size on the density profiles in simulations is demonstrated in Figure S13 in the Supporting Information. Bottom left: bilayer thickness. Thickness is defined as twice the distance from the peak in electron density to the membrane core. Experimental data are extracted in a similar manner from electron density profiles obtained with X-ray scattering. The bin width used in the profiles is used as the error estimate. Bottom middle: area per phospholipid measured by dividing the total membrane area by the number of phospholipids. Error bars show standard error estimated using block averaging implemented in gmx analyze of GROMACS. The size dependency of the area per phospholipid is shown in Figure S12. Bottom right: effect of CHOL on the location of the first two minima in the form factor. The minima are extracted from the form factors interpolated to all CHOL concentrations (Figure S3) from experiment and simulation with the findpeaks function in Matlab. Because differences between experiments and simulations for the first minimum location are barely visible for some force fields, we have highlighted the relative deviations in Figure S5.
