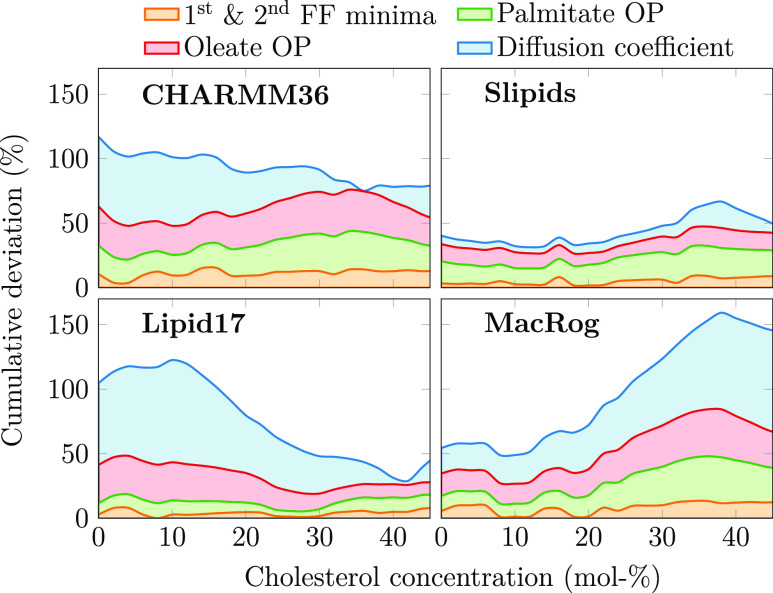
Figure 4.
Total relative deviation of force fields from experimental data. Two leftmost columns: the relative deviations in the first two form factor minima, POPC palmitate and oleate chain order parameters, and diffusion coefficients are shown in a cumulative manner to highlight the overall deviation of the force fields from experimental data. The order parameter deviations are obtained by averaging over the columns in Figure 1 and normalizing against experimental data. For the form factor minima (shown at the bottom right in Figure 2), the deviation was obtained by calculating the difference between experiment and simulation for both minima, normalizing each against experimental data, and summing the two together. The diffusion coefficient deviation is the difference of values from simulation and experiment in Figure 3, taken after interpolation to the same CHOL values as shown in Figures 1 and 2, and normalized against experimental values.

