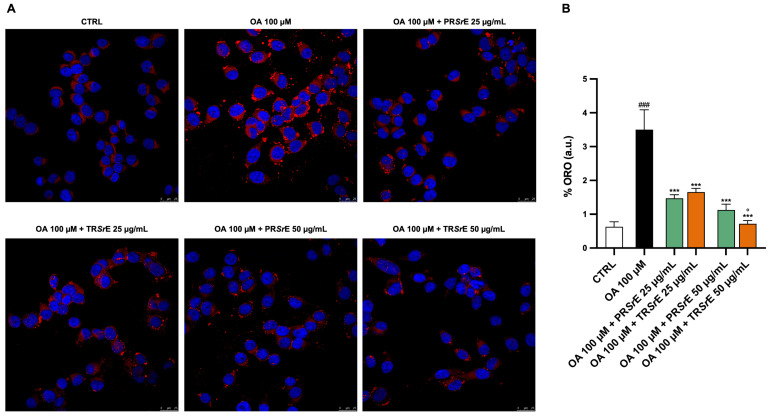
Figure 9.
Total fatty acid accumulation assessed using Oil Red O (ORO) staining. (A) Representative confocal images of OA-induced lipid accumulation in McA-RH7777. (B) The results are expressed as mean ± S.E.M.; ###: p < 0.001 vs. CTRL; ***: p < 0.001 vs. OA 100 µM; °: p < 0.05 vs. OA 100 µM + PRSrE 50 µg/mL.

