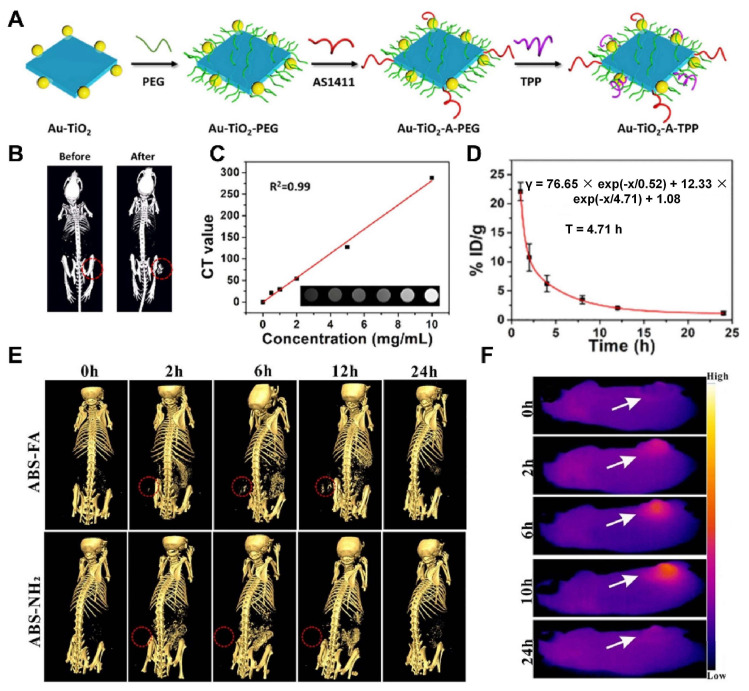
Figure 4.
(A) The process of synthesis of Au-TiO2-A-TPP. (B) Comparison of CT images of mice before and after intravenous injection of Au-TiO2-A-TPP (10 mg/kg). The red circles highlight the tumor sites. (C) In vitro CT imaging and CT signal values about different concentrations of Au-TiO2-A-TPP. (D) Blood circulation time in MCF-7 tumor-bearing mice after intravenous injection of Au-TiO2-A-TPP (10 mg/kg). (E) CT imaging of HeLa tumor-bearing mice after in vivo injection of ABS-FA and ABS; red dashed circle: tumor sites. (F) Low power (0.35 W/cm2) infrared thermograms of tumor-bearing mice taken at different time points. The white arrows highlight the tumor sites. Notes: (A–D) Adapted with permission from Ref. [51]. Copyright 2019, American Chemical Society. (E,F) Adapted with permission from Ref. [48]. Copyright 2020, American Chemical Society.

