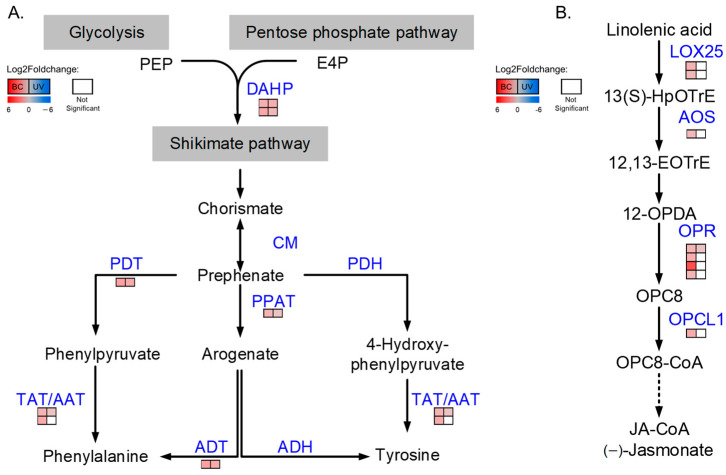
Figure 9.
DEPs involved in phenylalanine and tyrosine biosynthesis pathway (A) and JA biosynthesis (B). Each line of squares represented a protein. Filled color represented Log2Foldchange in proteins. Left column represented Log2Foldchange in BC group, and right column represented Log2Foldchange in UVB group.

