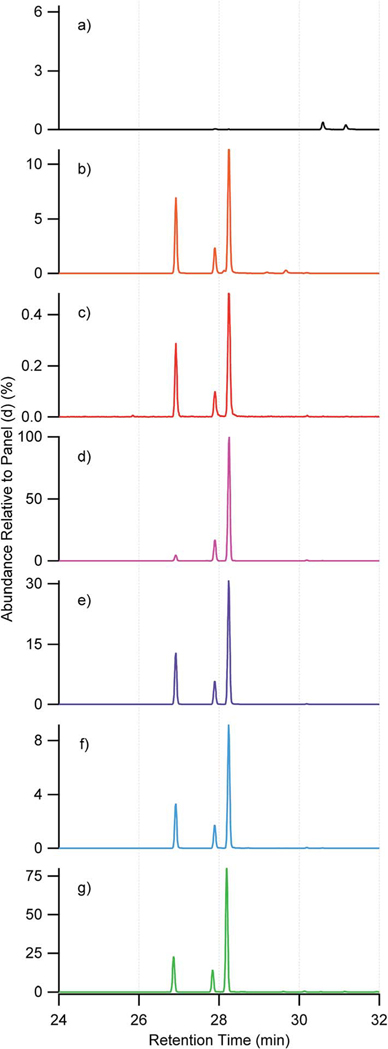
Fig. 5.
GC/EI-MS EICs of m/z 231 corresponding to C5-alkene triols (RT 26.9, 27.9, 28.3 min) from: (a) 50 μg mL−1 standard of 2-methyltetrol; (b) 50 μg mL−1 standard of 2-methyltetrol sulfate; (c) 50 μg mL−1 standard of 3-methyltetrol sulfate; (d) laboratory-generated β-IEPOX SOA; (e) laboratory-generated δ-IEPOX SOA; (f) PM2.5 sample at Look Rock during 2013 SOAS campaign; (g) PM2.5 sample at Manaus in Nov. 2016. Note that the y-axis scale was adjusted to the highest peak in each panel, with the labelled abundance in percentage relative to that in panel (d).

