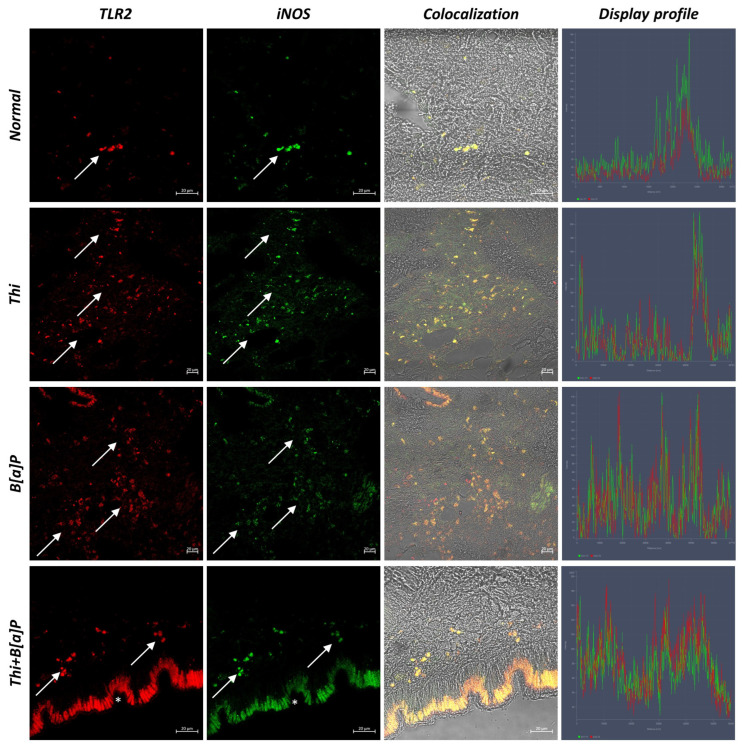
Figure 3.
Cross section of mantle of M. galloprovincialis (40×, scale bar: 20 µm). Confocal microscopy analysis shows hemocytes positive for TLR2 (red) and iNOS (green) (arrow). Not all hemocytes colocalize for the antibodies tested. Colocalized hemocytes can be seen in yellow. In groups exposed to pollutants, an increase in the number of immunoreactive hemocytes is observed. Strongly antibody-reactive epithelial cells are observed in the exposed groups (*). Use of the “display profile” function confirms the colocalization of antibodies.

